
YEAR-ON-YEAR
Philippines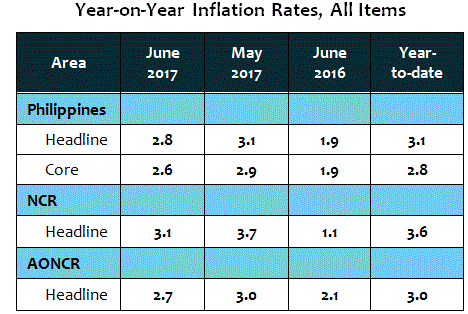
The country’s headline inflation further eased to 2.8 percent in June 2017. It was posted at 3.1 percent in May 2017 and 1.9 percent in June 2016. The indices of the following commodity groups registered lower annual gains during the month:
- Food and Non-Alcoholic Beverages (3.5%)
- Clothing and Footwear; Housing, Water, Electricity, Gas and Other Fuels; and Furnishing, Household Equipment and Routine Maintenance of the House (2.1%)
- Transport (2.3%)
- Recreation and Culture (1.1%).
Meanwhile, higher annual growths were observed in alcoholic beverages and tobacco index at 6.2 percent; health index, 2.3 percent; education index, 2.1 percent; and restaurant and miscellaneous goods and services index, 1.7 percent. The 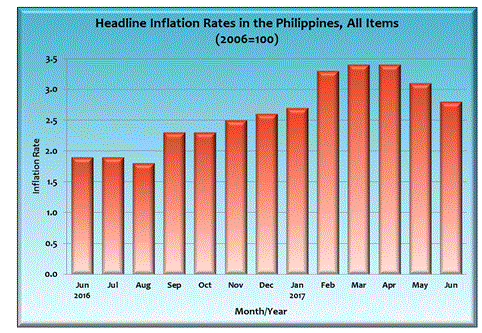 annual rate of communication index remained at 0.3 percent (see Tables 6 and 8).
Similarly, excluding selected food and energy items, core inflation continued to move at a slower pace at 2.6 percent in June 2017. It was recorded at 2.9 percent in May 2017 and 1.9 percent during the same month in the previous year (see Table 15).
The food alone index in the Philippines furher decelerated to 3.6 percent in June 2017. It was pegged at 3.8 percent in May 2017 and 3.0 percent in June 2016 (see Table 13).
An annual drop of 2.1 percent was still observed in sugar, jam, honey, chocolate and confectionery index. Moreover, slower annual mark-ups were seen in all the other food groups except for the indices of corn, meat, and fish. The index for corn moved up by 0.2 percent from -0.8 percent in the previous month. Likewise, the index for meat had a higher annual growth of 4.8 percent while that for the fish index remained at 8.0 percent (see Table 10).
| Year-on-Year Inflation Rates in the Philippines, All Items January 2012 - May 2017 (2006=100) | ||||||
|---|---|---|---|---|---|---|
| Month | Year | |||||
| 2012 | 2013 | 2014 | 2015 | 2016 | 2017 | |
| Jan | 4.0 | 3.1 | 4.2 | 2.4 | 1.3 | 2.7 |
| Feb | 2.7 | 3.4 | 4.1 | 2.5 | 0.9 | 3.3 |
| Mar | 2.6 | 3.2 | 3.9 | 2.4 | 1.1 | 3.4 |
| Apr | 3.0 | 2.6 | 4.1 | 2.2 | 1.1 | 3.4 |
| May | 3.0 | 2.6 | 4.5 | 1.6 | 1.6 | 3.1 |
| Jun | 2.9 | 2.7 | 4.4 | 1.2 | 1.9 | 2.8 |
| Jul | 3.2 | 2.5 | 4.9 | 0.8 | 1.9 | |
| Aug | 3.8 | 2.1 | 4.9 | 0.6 | 1.8 | |
| Sep | 3.7 | 2.7 | 4.4 | 0.4 | 2.3 | |
| Oct | 3.2 | 2.9 | 4.3 | 0.4 | 2.3 | |
| Nov | 2.8 | 3.3 | 3.7 | 1.1 | 2.5 | |
| Dec | 3.0 | 4.1 | 2.7 | 1.5 | 2.6 | |
| Ave | 3.2 | 3.0 | 4.1 | 1.4 | 1.8 | |
National Capital Region (NCR)
Inflation in NCR likewise eased to 3.1 percent in June 2017. Inflation was seen at 3.7 percent in May 2017 and 1.1 percent in June 2016. Contibuting to the downtrend were the slower annual add-ons registered in the indices of the following commodity groups:
- Food and Non-alcoholic Beverages (5.7%)
- Housing, Water, Electricity, Gas and Other Fuels (0.4%)
- Recreation and Culture (1.9%)
- Education (1.7%)
The rest of the commodity groups either had higher annual growths or retained their previous month’s rate (see Table 6 and Table 8).
Areas Outside NCR (AONCR)
Inflation in AONCR slowed down to 2.7 percent in June 2017. It was posted at 3.0 percent in May 2017 and 2.1 percent during the same month a year ago. Lower annual movements seen in the indices of all the commodity groups except alcoholic beverages and tobacco; communication; and education (see Table 6 and Table 8).
Lower annual growths were observed in eleven regions. The lowest rate of 0.8 percent was noticed in SOCCSKSARGEN while the highest still remained in Bicol Region at 5.1 percent
(see Table 8).
MONTH-ON-MONTH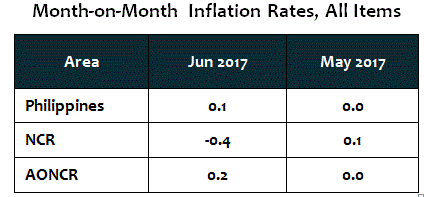
Consumer prices at the country level generally went up by 0.1 percent in June 2017. In the previous month, it registered a zero growth. Faster rates were recorded in the indices of the following commodity groups:
- Food and Non-alcoholic Beverages and Alcoholic Beverages and Tobacco (0.4%)
- Recreation and Culture ( 0.2%)
- Restaurant and Miscellaneous Goods and Services (0.4%)
In addition, education index went up by 2.0 percent from a zero growth in the previous month. On the contrary, the indices for housing, water, electricity, gas and other fuels further declined by 1.2 percent and transport, -0.3 percent. The rest of the commodity groups retained their previous month’s rate (see Table 7).
Upward price adjustments were noticed in the heavily-weighted food items such as rice, corn, fish, vegetables and meat. Tuition fee hikes in most of the regions and increased prices of meals eaten outside the home in some provinces were also noted during the month.
Meanwhile, many regions registered lower charges in electricity rates and price reductions in petroleum products such as LPG, kerosene, gasoline and diesel. Similarly, cheaper air and ship fares were also registered in many regions this month.
Notes:
- Due to the peace and order problem in Marawi City, the province of Lanao del Sur was not able to conduct the price surveys during the month of June 2017. Hence, the computation of CPI for June 2017 excluded this province.
- For comparability purposes, the CPIs were recomputed for the Philippines, AONCR and ARMM for the months of May 2016, June 2016, April 2017 and May 2017 which excluded the province of Lanao del Sur.
- Special tables were attached to this report comparing the results of the inflation rates for May 2017 excluding and including Lanao del Sur in the computation (Table A and Table B).
- CPIs and inflation rates by province and selected city are also available upon request at Philippine Statistics Authority, Economic Sector Statistics Service, Price Statistics Division (Telephone Number: 376-19-59).
(Sgd) LISA GRACE S. BERSALES, Ph.D.
Undersecretary
National Statistician and Civil Registrar General