
| Year-on-Year Inflation Rates, All Items | ||||
|---|---|---|---|---|
| Mar 2015 | Feb 2015 | Mar 2014 | Year-to-date | |
| Philippines | ||||
| Headline | 2.4 | 2.5 | 3.9 | 2.5 |
| Core | 2.7 | 2.5 | 2.8 | 2.5 |
| NCR | ||||
| Headline | 1.9 | 2.2 | 2.9 | 1.9 |
| AONCR | ||||
| Headline | 2.6 | 2.6 | 4.2 | 2.6 |
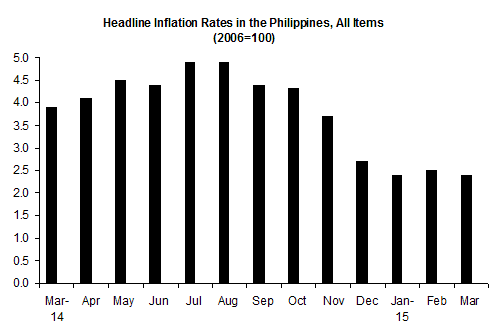
The annual headline inflation at the national level exhibited a slower pace of 2.4 percent in March. Last month, it was recorded at 2.5 percent and in March 2014, 3.9 percent. The indices of housing, water, electricity, gas and other fuels; transport and communication continued to post negative annual rates. Slowdowns in the annual increases were also noted in all the other commodity groups except in the indices for alcoholic beverages and tobacco; education; and restaurant and miscellaneous goods and services.
Excluding selected food and energy items, core inflation further went up to 2.7 percent in March. It was posted at 2.5 percent in February and 2.8 percent in March 2014.
Inflation in NCR likewise settled to 1.9 percent in March. It was registered at 2.2 percent last month and 2.9 percent during the same period a year ago. This was primarily attributed to the annual decline still observed in the index of housing, water, electricity, gas and other fuels. Lower annual growths were also noticed in the indices of food and non-alcoholic beverages; alcoholic beverages and tobacco; clothing and footwear; furnishing, household equipment and routine maintenance of the house; health; and transport.
Inflation in Areas Outside NCR (AONCR) was pegged at 2.6 percent in March. It was the same rate recorded last month. In March 2014, the rate was 4.2 percent. Mixed movements in the annual growths among the commodity groups were posted during the month. The indices for food and non-alcoholic beverages; clothing and footwear; health; recreation and culture; and restaurant and miscellaneous goods and services exhibited lower annual rates while annual declines were seen in the indices of housing, water, electricity, gas and other fuels; transport; and communication. Those for the rest of the commodity groups remained at their previous month’s rates.
| Year-on-Year Inflation Rates in the Philippines, All Items January 2010 - March 2015 (2006=100) | ||||||
|---|---|---|---|---|---|---|
Month | Year | |||||
| 2010 | 2011 | 2012 | 2013 | 2014 | 2015 | |
| January | 3.9 | 4.0 | 4.0 | 3.1 | 4.2 | 2.4 |
| February | 3.9 | 4.7 | 2.7 | 3.4 | 4.1 | 2.5 |
| March | 3.9 | 4.9 | 2.6 | 3.2 | 3.9 | 2.4 |
| April | 4.0 | 4.7 | 3.0 | 2.6 | 4.1 | |
| May | 3.9 | 4.9 | 3.0 | 2.6 | 4.5 | |
| June | 3.6 | 5.2 | 2.9 | 2.7 | 4.4 | |
| July | 3.7 | 4.9 | 3.2 | 2.5 | 4.9 | |
| August | 4.1 | 4.6 | 3.8 | 2.1 | 4.9 | |
| September | 3.8 | 4.7 | 3.7 | 2.7 | 4.4 | |
| October | 3.3 | 5.2 | 3.2 | 2.9 | 4.3 | |
| November | 3.7 | 4.7 | 2.8 | 3.3 | 3.7 | |
| December | 3.6 | 4.2 | 3.0 | 4.1 | 2.7 | |
| Average | 3.8 | 4.6 | 3.2 | 3.0 | 4.1 | |
| Month-on-Month Inflation Rates, All Items (2006=100) | ||
|---|---|---|
| Mar 2015 | Feb 2015 | |
| Philippines | -0.1 | 0.1 |
| NCR | -0.3 | 0.6 |
| AONCR | -0.1 | 0.0 |
The country’s consumer prices generally went down by 0.1 percent in March. This was due to lower prices of the heavily-weighted food items particularly rice, meat, fish, and vegetables. Many regions also recorded downward price adjustments in corn and sugar. In addition, lower charges in the electricity rates, price decline in LPG and reduction in the flag down rate in taxis in NCR were reported during the month.
CONSUMER PRICE INDEX
(2006=100)
MARCH 2015
By Region, Year-on-Year
- Inflation in NCR eased to 1.9 percent in March.
Inflation in AONCR however, remained at 2.6 percent in March. Seven regions had higher annual mark-ups while the rest of the regions had slower annual growths with CALABARZON and SOCCSKSARGEN retaining their respective last month’s rates of 2.3 percent and 2.8 percent. The highest annual growth of 3.6 percent was posted in Caraga while the lowest was in Northern Mindanao at 1.7 percent.
By Commodity Group, Year-on-Year
The annual change in housing, water, electricity, gas and other fuels and transport indices at the national level dropped by 0.2 percent in March and communication index, -0.1 percent. Moreover, all the other commodity groups posted slower annual mark-ups except for the indices of alcoholic beverages and tobacco; education and recreation and culture which retained their respective last month’s rates of 3.9 percent; 5.1 percent and 1.5 percent.
The annual growth of the country’s food alone index improved to 4.4 percent in March. It was registered at 4.9 percent last month and 6.0 percent in March 2014.
All the food groups had lower annual growths except for the indices of fish, vegetables and food products not elsewhere classified. While the index for fish retained its last month’s rate, the indices of vegetables and food products not elsewhere classified had higher annual gains.
In NCR, the index of housing, water, electricity, gas and other fuels declined by 0.2 percent. Slower annual growths were also noted in all the other commodity groups except for the indices of recreation and culture, education; and restaurant and miscellaneous goods and services which retained their last month’s rates.
A lower annual rate of 3.9 percent was seen in NCR’s food alone index in March. Its previous month’s annual growth was 5.2 percent and in March 2014, 5.6 percent.
Slower annual increments were noticed in the rice index at 3.2 percent; other cereals, flour, cereal preparation, bread, pasta, and other bakery products index, 1.9 percent; meat index, 3.2 percent; fish index, 3.8 percent; milk, cheese and egg index, 4.9 percent; fruit index, 9.0 percent; and food products not elsewhere classified index, 4.2 percent. The rest of the food groups had faster annual gains.
In AONCR, the annual add-on in food and non-alcoholic beverages index slowed to 4.4 percent in March; clothing and footwear index, 2.8 percent; health index, 2.1 percent; recreation and culture index, 0.8 percent; and restaurant and miscellaneous goods and services index, 1.6 percent. While the index for alcoholic beverages and tobacco had a higher annual mark up at 4.3 percent, the rest of the commodity groups either recorded annual declines or retained their last month’s rate.
The food alone index in AONCR further improved to 4.5 percent in March. Last month, it was observed at 4.8 percent and in March 2014, 6.1 percent.
A lower annual growth of 5.9 percent was recorded in the rice index. SOCCSKSARGEN posted a 0.2 percent annual decrease, the lowest rate among the regions. Moreover, twelve regions had slower annual hikes. Meanwhile, the highest rate of 8.7 percent remained in Central Luzon.
Except for the indices of fish; vegetable; and food products not elsewhere classified which have higher annual increments, all the other food groups had slower annual increases.
By Region, Month-on-Month
Consumer prices in NCR generally declined by 0.3 percent in March. Last month, it went up by 0.6 percent. Downward adjustment were observed in the indices of food and non-alcoholic beverages at -0.8 percent; housing, water, electricity, gas and other fuels; -0.2 percent; and transport, -0.3 percent. Moreover, movements in alcoholic beverages and tobacco and recreation and culture decelerated. On the contrary, the health index posted a higher growth of 0.1 percent while the rest of the commodity groups either retained their last month’s rate or had zero growth.
The heavily-weighted food and non-alcoholic beverages index went down by 0.3 percent thus, pushing down the all items index in AONCR by 0.1 percent in March. Contributing to the downtrend were the slower rates registered in the indices of alcoholic beverages and tobacco at 0.4 percent; clothing and footwear and restaurant and miscellaneous goods and services, 0.1 percent; furnishing, household equipment and routine maintenance of the house, 0.2 percent; and transport, 0.5 percent. The rest of the commodity groups either had zero growth or retained their previous month’s rate.
Negative rates were seen in Central Luzon, CALABARZON, MIMAROPA, Bicol and Zamboanga Peninsula regions. Meanwhile, higher rates were noted in Ilocos, Cagayan Valley, Northern Mindanao and SOCCSKSARGEN. The other regions either had zero growths or retained their previous month’s rate.
Among the three big areas of the country, consumer prices in Luzon were generally lower by 0.1 percent. Prices in Visayas were generally stable as it had a zero growth while Mindanao prices went up 0.1 percent.
By Commodity Group, Month-on-Month
Prices of consumer items at the national level moved down by 0.1 percent in March as the heavily-weighted food and non-alcoholic beverage index fell by 0.4 percent. Except for the indices of health and restaurant and miscellaneous goods and services which retained their last month’s rate of 0.1 percent, all the other commodity groups either had slower monthly increases or zero growths.
The vegetable index in the Philippines continued to register a negative monthly rate at -2.3 percent; NCR, -0.7 percent; and AONCR, -2.6 percent, This was due to lower prices of vegetables particularly lowland grown vegetables brought about by their sufficient supplies in the markets.
The downward price adjustment in rice still observed in many regions pushed down the group’s index in the Philippines by 0.5 percent; NCR, -1.7 percent; and AONCR, -0.3 percent.
Cheaper prices of chicken in most of the regions resulted to the decline in the meat index in the Philippines at -0.4 percent; NCR, -0.9 percent; and AONCR, -0.3 percent. Reductions in the prices of beef and pork were also noted in selected regions.
The fish index in the Philippines dropped by 0.4 percent; NCR, -2.3 percent; and AONCR, -0.1 percent. The good catch of fishermen brought about by the prevalence of good weather conditions reduced prices of fresh fish in the wet markets during the month.
Price increments in selected condiments were noticed in many regions. Thus, the food products not elsewhere classified index in the Philippines rose 0.5 percent; NCR, 1.0 percent; and AONCR, 0.4 percent.
The milk, cheese and egg index in the three areas inched up 0.1 percent as milk, cheese and egg in many regions were priced higher during the month.
The 0.5 percent gain in the index for housing, water, electricity, gas and other fuels in AONCR was attributed to the increased charges in electricity rates in most of the regions together with the upward price adjustments in selected construction materials. On the contrary, charges in the electricity rates in NCR were lower, thereby pushing down its group’s index by 0.2 percent. Downward adjustments in the prices of LPG in the area were also observed. At the national level, the index went up 0.2 percent.
The transport index in AONCR rose 0.5 percent due to price increments in gasoline and diesel. Meanwhile, the group’s index in NCR decreased by 0.3 percent as the flag down rate in taxis went down during the month. The national transport index moved up by 0.3 percent.
With higher prices of alcoholic beverages in most of the regions, the index for alcoholic beverages and tobacco in the Philippines grew by 0.3 percent; NCR, 0.1 percent; and AONCR, 0.4 percent. Prices of cigarettes likewise increased in many regions during the month.
Note: CPIs and inflation rates by province and selected city are also available upon request at Philippine Statistics Authority, Economic Sector Statistics Services, Economic Indices and Indicators Division (Telephone Numbers: 716-39-35).
(Sgd.) LISA GRACE S. BERSALES, Ph.D.
National Statistician