
MAY AND APRIL 2013
| Year-on-Year Inflation Rates, All Items | |||
|---|---|---|---|
| May 2013 | April 2013 | Year-to-date | |
| Philippines | |||
| Headline | 2.6 | 2.6 | 3.0 |
| Core | 3.0 | 3.1 | 3.4 |
| NCR | |||
| Headline | 1.8 | 1.7 | 2.0 |
| AONCR | |||
| Headline | 2.9 | 2.8 | 3.3 |
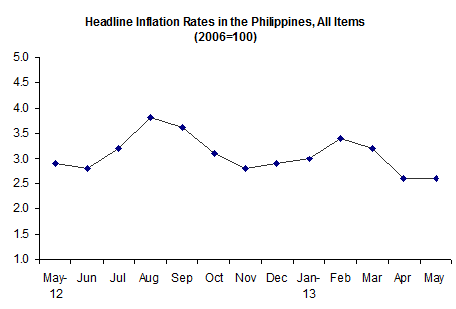
The Philippines’ year-on-year headline inflation remained at its previous month’s rate of 2.6 percent. This can be attributed to the mixed movements in the annual growths among the commodity groups. The indices for food and non-alcoholic beverages and housing, water, electricity, gas and other fuels recorded higher rates while the indices of the seven other commodity groups had slowdowns. The index for transport had a negative rate while the education index retained its previous month’s rate. Inflation a year ago was 2.9 percent.
Excluding selected food and energy items, annual core inflation further dipped to 3.0 percent in May from 3.1 percent in April.
Annual inflation in the National Capital Region (NCR) went up to 1.8 percent in May from 1.7 percent in April. Higher annual increases were observed in the indices of food and non-alcoholic beverages and housing, water, electricity, gas and other fuels.
Similarly, annual inflation in Areas Outside NCR (AONCR) rose 2.9 percent in May from 2.8 percent in April. Annual growths in food and non-alcoholic beverages and housing, water, electricity, gas and other fuels indices moved upward during the month.
| Year-on-Year Inflation Rates in the Philippines, All Items | ||||||
|---|---|---|---|---|---|---|
| Month | Year | |||||
| 2008 | 2009 | 2010 | 2011 | 2012 | 2013 | |
| January | 4.6 | 7.1 | 3.9 | 4.0 | 4.0 | 3.0 |
| February | 5.1 | 7.2 | 3.9 | 4.7 | 2.7 | 3.4 |
| March | 5.9 | 6.7 | 3.9 | 4.9 | 2.6 | 3.2 |
| April | 7.3 | 5.6 | 4.0 | 4.7 | 3.0 | 2.6 |
| May | 8.2 | 4.3 | 3.9 | 4.9 | 2.9 | 2.6 |
| June | 9.4 | 3.2 | 3.6 | 5.2 | 2.8 | |
| July | 10.2 | 2.2 | 3.7 | 4.9 | 3.2 | |
| August | 10.5 | 1.7 | 4.1 | 4.6 | 3.8 | |
| September | 10.1 | 2.3 | 3.8 | 4.7 | 3.6 | |
| October | 9.7 | 2.9 | 3.3 | 5.2 | 3.1 | |
| November | 9.1 | 3.5 | 3.7 | 4.7 | 2.8 | |
| December | 7.8 | 4.4 | 3.6 | 4.2 | 2.9 | |
| Average | 8.3 | 4.2 | 3.8 | 4.6 | 3.2 | |
| Month-on-Month Inflation Rates, All Items | ||
|---|---|---|
| May 2013 | Apr 2013 | |
| Philippines | 0.1 | 0.2 |
| NCR | 0.1 | 0.1 |
| AONCR | 0.1 | 0.2 |
-
Price increments on consumer items in the Philippines slowed down to 0.1 percent in May from 0.2 percent in April. While price gains were noted in the heavily-weighted food items such as rice, corn, meat, vegetables and selected condiments and seasonings in NCR and in many regions, these were tempered by the slower and negative rates recorded in the prices of items in the other commodity groups.
CONSUMER PRICE INDEX
(2006=100)MAY 2013
By Region, Year-on-Year
-
The annual inflation in NCR rose 1.8 percent in May from 1.7 percent in April.
-
Likewise, the annual inflation in AONCR picked up 2.9 percent in May from 2.8 percent in April. Higher annual upticks were registered in eight regions with the biggest increase of 0.5 percentage point posted in Ilocos (2.0% from 1.5%) and Northern Mindanao (4.3% from 3.8%). The highest annual rate remained in Central Visayas at 4.6 percent.
By Commodity Group, Year-on-Year
-
The heavily-weighted food and non-alcoholic beverages index in the Philippines advanced 2.4 percent in May from 2.2 percent in April and housing, water, electricity, gas and other fuels index, 1.5 percent from 1.3 percent. The index for education retained its last month’s rate of 4.4 percent. The rest of the commodity groups recorded slower annual increments with the transport index still posting a negative annual rate of 0.5 percent from -0.7 percent.
The country’s inflation in the food alone index climbed 2.4 percent in May from 2.1 percent in April.
The rice index registered a higher annual uptick at 1.5 percent in May from 1.4 percent in April; corn index, 5.7 percent from 5.3 percent; meat index, 2.4 percent from 2.0 percent; fish index, 2.6 percent from 2.1 percent; fruit index, 5.2 percent from 5.0 percent; and vegetables index, 4.8 percent from 3.5 percent. Meanwhile, movement in the other food groups decelerated with a negative annual rate still noted in the oils and fats index.
-
In NCR, a higher annual mark-up was posted in the heavily-weighted food and non-alcoholic beverages index at 2.1 percent in May from 1.9 percent in April and housing, water, electricity, gas and other fuels index, 0.7 percent from 0.6 percent. On the other hand, an annual decline of 0.9 percent was still observed in the transport index from -1.8 percent. The rest of the commodity groups moved up at slower rates except for the indices of alcoholic beverages and tobacco and education.
-
The food alone index in NCR rose 2.1 percent in May from 1.9 percent in April.
-
From a decline of 0.5 percent last month, the fish index grew by 0.6 percent in May. A higher annual rate was also observed in the corn index at 0.8 percent from 0.1 percent in April; meat index, 2.7 percent from 2.5 percent; vegetables index, 3.6 percent from 1.7 percent; and food products not elsewhere classified index, 2.8 percent from 0.8 percent. The annual upticks in all the other food groups decelerated with the index for oils and fats still recording a negative rate.
-
-
The annual growth in food and non-alcoholic beverages index in AONCR went up to 2.4 percent in May from 2.3 percent in April and housing, water, electricity, gas and other fuels index, 1.8 percent from 1.6 percent. The rest of the commodity groups either have slower annual increments or negative rate. The index for education retained its previous month’s rate of 4.7 percent.
-
A faster annual increase of 2.4 percent was noted in the food alone index in AONCR in May from 2.2 percent in April.
-
With eight regions having higher annual upticks, the rice index gained by 1.5 percent in May from 1.4 percent in April. The biggest jump of 2.0 percentage points was seen in Northern Mindanao (2.8% from 0.8%).
-
Except for the indices of milk, cheese and egg; oils and fats; sugar, jam, honey, chocolate and confectionery; and food products not elsewhere classified, the rest of the food groups have higher annual rates.
-
By Region, Month-on-Month
Prices of consumer items in NCR during the month moved up at the same rate in April at 0.1 percent. From zero growth, the index for food and non-alcoholic beverages went up 0.4 percent while furnishing, household equipment and routine maintenance of the house and restaurant and miscellaneous goods and services indices, 0.1 percent. Except for the housing, water, electricity, gas and other fuels index whose rate dropped by 0.3 percent, the rest of the commodity groups either have zero or slower monthly growths.
Price increments in AONCR improved to 0.1 percent in May from 0.2 percent in April. This can be attributed to a 0.2 percent decline in the index for transport and -0.1 percent for communication index. Moreover, the rest of the commodity groups have lower monthly hikes, except for the index of recreation and culture whose adjustment inched up 0.2 percent from 0.1 percent. Movement in the index for food and non-alcoholic beverages index remained at 0.1 percent.
Price additions in six regions were slower. Moreover, a zero growth was noted in CALABARZON while a negative monthly rate of 0.1 percent, the lowest rate during the month was seen in SOCCSKASARGEN.
Among the three big areas of the country, price increases in consumer items in Visayas and Mindanao were slower than those in Luzon.
By Commodity Group, Month-on-Month
-
Measured from a month ago level, prices in the Philippines went up but at a slower rate of 0.1 percent in May from 0.2 percent in April. The index of transport went down by 0.2 percent and communication index, -0.1 percent. In addition, all the commodity groups recorded slower monthly mark-ups, except for the index of recreation and culture whose rate was higher at 0.2 percent from 0.1 percent. The food and non-alcoholic beverages and education indices retained their corresponding previous month’s rate of 0.1 percent and zero growth.
-
Consumers demand for meat increased as they had additional purchases for the traditional “fiesta” celebrations during the month. The campaign and election period also brought higher demand for meat. These factors raised prices of fresh beef, pork, chicken and processed meat in the markets. Thus, the index for meat in the Philippines rose 0.4 percent; NCR, 0.7 percent; and AONCR, 0.3 percent.
-
The index for rice in the three areas inched up by 0.3 percent during the month. Nine regions posted higher growth rates with the biggest increase of 1.1 percent in Northern Mindanao.
-
The hot weather conditions experienced during the month caused high spoilage of some vegetables in NCR. It triggered higher prices of vegetables in the area particularly carrots, tomatoes, baguio beans and onions. Thus, the vegetables index in NCR accelerated by 2.0 percent from 0.7 percent in April. In AONCR, mixed price movements of vegetables observed among the regions resulted to a steady growth in its group’s index at 0.3 percent. At the national level, the vegetables index gained 0.5 percent from 0.4 percent.
-
Price hikes in selected condiments and seasonings caused a 1.3 percent hike in the food products not elsewhere classified index in NCR; 0.5 percent in AONCR; and 0.7 percent in the Philippines.
-
The general upward adjustments in the prices of sugar in many regions primarily pushed up the group’s index for sugar, jam, honey, chocolate and confectionery in AONCR by 0.8 percent and in the Philippines, 0.6 percent. On the contrary, the group’s index in NCR dropped by 0.3 percent due to price reduction in sugar.
-
The prevalence of good weather conditions favored fishermen in catching fish. It brought abundant supplies of fish in the markets particularly the brackishwater fish species. Hence, the fish index in the Philippines decreased by 0.6 percent; NCR, -0.1 percent; and AONCR, -0.7 percent.
-
The index for oils and fats in the Philippines fell by 0.8 percent; NCR, -1.3 percent; and AONCR, -0.6 percent. This was due to the downtrend in the prices of cooking oil.
-
-
The index for restaurant and miscellaneous goods and services in the Philippines and AONCR picked up 0.2 percent and NCR, 0.1 percent as prices of some items for personal care and effects went up during the month.
-
Price additions in alcoholic beverages and tobacco continued to slow down. Hence, the growth in the group’s index in the three areas decelerated: Philippines, 0.4 percent from 1.0 percent and NCR and AONCR, 0.3 percent from 0.8 percent and 1.1 percent, respectively.
-
During the month, lower charges for electricity rates along with the price decreases in LPG and kerosene in NCR pushed down its index for housing, water, electricity, gas and other fuels by -0.3 percent from a growth of 0.2 percent last month. Meanwhile, the group’s index in AONCR moved up at slower pace of 0.2 percent from 0.5 percent as higher electricity rates and increased wages of carpenter, plumber and electrician in some regions were tempered by the price reductions in LPG and kerosene. This resulted to a slower growth of 0.1 percent from 0.5 percent in the group’s national index.
-
The transport index in AONCR declined by 0.2 percent due to price rollbacks in gasoline and diesel. On the other hand, the index in NCR had a zero growth during the month as the downward price adjustments in gasoline and diesel in the area did not affect the movement of the index. At the national level, the transport index dropped by 0.2 percent.
NOTES:
CPIs and inflation rates by province and selected city are also available upon request at NSO, Industry and Trade Statistics Department, Economic and Indicators Division (Telephone Numbers: 716-39-35 and 715-33-47).
(Sgd.) CARMELITA N. ERICTA
Administrator