
OCTOBER AND SEPTEMBER 2013
| Year-on-Year Inflation Rates, All Items | |||
|---|---|---|---|
| October 2013 | September 2013 | Year-to-date | |
| Philippines | |||
| Headline | 2.9 | 2.7 | 2.8 |
| Core | 2.5 | 2.3 | 2.9 |
| NCR | |||
| Headline | 1.1 | 1.1 | 1.5 |
| AONCR | |||
| Headline | 3.4 | 3.1 | 3.1 |
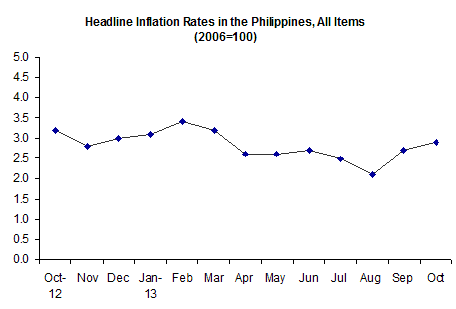
Headline inflation at the national level advanced 2.9 percent in October from 2.7 percent in September. The uptrend was due to higher annual increases in the heavily-weighted food and non-alcoholic beverages index and clothing and footwear index. Inflation a year ago was 3.2 percent.
Excluding selected food and energy items, core inflation picked up to 2.5 percent in October from 2.3 percent in September.
Inflation in the National Capital Region (NCR) remained at its last month’s rate of 1.1 percent. This was effected by the mixed movements in the annual growths among the commodity groups. The index for food and non-alcoholic beverages index recorded a higher annual rate while the indices of alcoholic beverages and tobacco; clothing and footwear; and health had slowdowns. The indices for housing, water, electricity, gas and other fuels and transport had negative rates while the rest of the commodity groups retained their previous month’s rate.
In Areas Outside NCR, inflation moved faster at 3.4 percent in October from 3.1 percent in September. Higher annual mark-ups were posted in the indices of food and non-alcoholic beverages; clothing and footwear; housing, water, electricity, gas and other fuels; and recreation and culture.
| Year-on-Year Inflation Rates in the Philippines, All Items | ||||||
|---|---|---|---|---|---|---|
| Month | Year | |||||
| 2008 | 2009 | 2010 | 2011 | 2012 | 2013 | |
| January | 4.6 | 7.1 | 3.9 | 4.0 | 4.0 | 3.1 |
| February | 5.1 | 7.2 | 3.9 | 4.7 | 2.7 | 3.4 |
| March | 5.9 | 6.7 | 3.9 | 4.9 | 2.6 | 3.2 |
| April | 7.3 | 5.6 | 4.0 | 4.7 | 3.0 | 2.6 |
| May | 8.2 | 4.3 | 3.9 | 4.9 | 3.0 | 2.6 |
| June | 9.4 | 3.2 | 3.6 | 5.2 | 2.9 | 2.7 |
| July | 10.2 | 2.2 | 3.7 | 4.9 | 3.2 | 2.5 |
| August | 10.5 | 1.7 | 4.1 | 4.6 | 3.8 | 2.1 |
| September | 10.1 | 2.3 | 3.8 | 4.7 | 3.7 | 2.7 |
| October | 9.7 | 2.9 | 3.3 | 5.2 | 3.2 | 2.9 |
| November | 9.1 | 3.5 | 3.7 | 4.7 | 2.8 | |
| December | 7.8 | 4.4 | 3.6 | 4.2 | 3.0 | |
| Average | 8.3 | 4.2 | 3.8 | 4.6 | 3.2 | |
| Month-on-Month Inflation Rates, All Items | ||
|---|---|---|
| Oct 2013 | Sep 2013 | |
| Philippines | 0.1 | 0.6 |
| NCR | -0.1 | 0.5 |
| AONCR | 0.2 | 0.6 |
-
Price hikes in consumer items in the Philippines slowed down to 0.1 percent in October from 0.6 percent in September. This was due to lower charges in electricity rates together with price decreases in kerosene in many regions. Price reductions in corn, cooking oil and selected in-season fruits in NCR and some condiments and seasonings in many regions in AONCR also contributed to the downtrend. Moreover, price increases in rice slowed down during the month due to the on-going harvest season of palay.
CONSUMER PRICE INDEX
(2006=100)OCTOBER 2013
By Region, Year-on-Year
-
Inflation in NCR remained at its September rate of 1.1 percent.
-
In AONCR, inflation rose to 3.4 percent in October from 3.1 percent in September. Twelve regions registered higher annual rates with the biggest uptick of 1.1 percentage points noted in Ilocos region (3.0% from 1.9%).The highest annual inflation of 5.1 percent was observed in Eastern Visayas while the lowest annual rate of 2.5 percent was in CAR.
By Commodity Group, Year-on-Year
-
The annual rate of increment in the heavily-weighted food index in the Philippines was faster at 3.2 percent in October from 2.5 percent in September and clothing index, 3.0 percent from 2.9 percent. Slower annual hikes were however, recorded in the indices of alcoholic beverages and tobacco; housing, water, electricity, gas and other fuels; furnishing, household equipment and routine maintenance of the house; health; and transport. Those for the rest of the commodity groups remained at their last month’s rate.
The annual gain in the food alone index at the national level accelerated 3.4 percent in October from 2.5 percent in September.
The annual growth in the rice index climbed 7.8 percent in October from 7.1 percent in September; meat index, 2.2 percent from 2.0 percent; fish index, 2.5 percent from 1.5 percent; and food products not elsewhere classified index, 3.4 percent from 3.3 percent. Moreover, the vegetable index went up 1.2 percent from a drop of 3.7 percent last month.
The annual adjustments in the other food groups were either negative or at slower rates with the index for fruit retaining its last month’s growth of 3.8 percent.
-
In NCR, the annual inflation in food and non-alcoholic beverages index jumped to 2.5 percent in October from 1.0 percent in September. On the contrary, the annual gain in alcoholic beverages and tobacco index eased to 16.5 percent from 17.2 percent; clothing and footwear index, 1.8 percent from 1.9 percent; and health index, 3.0 percent from 3.1 percent. Negative annual rates were posted in the indices of housing, water, electricity, gas and other fuels and transport index. The annual change for the rest of the commodity groups remained at their respective September rates.
-
The annual growth in the food alone index in NCR advanced to 2.6 percent in October from 1.0 percent in September.
-
The annual increment in the rice index was higher at 9.4 percent in October from 7.3 percent in September; corn index, 4.7 percent from 4.3 percent; meat index, 0.5 percent from 0.2 percent; fish index, 1.2 percent from 0.7 percent; and food products not elsewhere classified index, 6.2 percent from 5.6 percent. In addition, the vegetables index rose 5.0 percent from an annual decline of 7.7 percent.
-
Meanwhile, slowdowns were noted in the indices of milk, cheese and egg and fruit at 1.1 percent and 0.9 percent, respectively from their corresponding last month’s rates of 1.2 percent and 1.7 percent. Negative annual rates were still registered in the indices of oils and fats and sugar, jam, honey, chocolate and confectionery.
-
-
In AONCR, higher annual mark-ups were posted in food and non-alcoholic beverages and clothing and footwear indices at 3.4 percent in October from their respective September rates of 2.8 percent and 3.2 percent; housing, water, electricity, gas and other fuels index, 1.6 percent from 1.5 percent; and recreation and culture index, 2.7 percent from 2.6 percent. The other commodity groups either had slower annual growths or retained their last month’s rate.
-
The annual inflation of the food alone index in AONCR climbed by 3.5 percent in October from 2.8 percent in September.
-
With eleven regions having higher rates, the annual increase in the rice index further soared to 7.6 percent in October from 7.1 percent in September. The biggest annual jump of 2.6 percentage points was in Ilocos region (7.8% from 5.2%).
-
The annual upticks in the meat and fish indices were also higher at 2.7 percent from 2.5 percent and 1.7 percent, respectively and fruit index, 4.6 percent from 4.4 percent. Moreover, the vegetable index moved up 0.5 percent from an annual reduction of 2.9 percent.
-
Slower increases or negative annual changes were recorded in the indices of the other food groups.
-
By Region, Month-on-Month
Prices of consumer items in NCR dropped by 0.1 percent in October from a growth of 0.5 percent in September. The indices for housing, water, electricity, gas and other fuels and transport fell by 1.1 percent and 0.3 percent, respectively. In addition, the annual hike in food and non-alcoholic beverages index eased to 0.8 percent from 1.1 percent and alcoholic beverages and tobacco index, 0.1 percent from 0.2 percent. Higher monthly growth rates were however, noted in the indices of clothing and footwear and furnishing, household equipment and routine maintenance of house at 0.1 percent from zero growth. The rest of the commodity groups posted zero growth during the month.
Prices in AONCR moved up at a slower pace of 0.2 percent in October from 0.6 percent in September. A negative monthly rate was noted in housing, water, electricity, gas and other fuels and transport indices at -0.2 percent from 0.3 percent and 0.2 percent, respectively. Also contributing to the downtrend was the deceleration in the monthly growth posted in food and non-alcoholic beverages index at 0.5 percent from 1.0 percent. On the contrary, adjustments in the indices for furnishing, household equipment and routine maintenance of the house and restaurant and miscellaneous goods and services went up 0.2 percent from 0.1 percent and in recreation and culture index, 0.1 percent from zero growth. The rest of the commodity groups either retained their previous month’s rate or had zero growth.
Thirteen regions had lower monthly rates with the lowest rate seen in Northern Mindanao and SOCCSKSARGEN at -0.1 percent.
Prices hikes of consumer items in the three big areas (Luzon, Visayas and Mindanao) were generally the same.
By Commodity Group, Month-on-Month
-
Price increases in consumer items at the national level improved to 0.1 percent in October from 0.6 percent in September. The index for housing, water, electricity, gas and other fuels dropped by 0.4 percent in October from 0.3 percent in September and transport index, -0.2 percent from 0.2 percent growth. Moreover, the uptick in the heavily-weighted food and non-alcoholic beverages index slowed down to 0.6 percent from 1.0 percent. However, higher monthly increments were seen in the indices of clothing and footwear; furnishing, household equipment and routine maintenance of the house; and restaurant and miscellaneous goods and services at 0.2 percent from 0.1 percent and recreation and culture index, 0.1 percent from zero growth. No movement was seen in the other commodity groups with the index for alcoholic beverages and tobacco retaining its last month’s growth of 0.2 percent.
-
Reduced volume in deliveries of vegetables in the markets were noted after typhoons and monsoon rains hit producing provinces in Central and Northern parts of Luzon. This supply situation effected higher prices of vegetables particularly the lowland-grown varieties during the month. Thus, the group’s index in the Philippines picked up 3.0 percent; NCR, 7.4 percent; and AONCR, 2.2 percent.
-
The unfavorable weather conditions limited fishing trips of fisherfolks during the month. This resulted to low supplies of selected fish species particularly roundscads, groupers and shrimps in many regions. Thus, the fish index in the Philippines and AONCR rose 0.9 percent and NCR, 0.8 percent.
-
With the on-going harvest season for palay, all the regions posted either lower or negative monthly rates in the rice index. In the Philippines and AONCR, the index moved up at a slower pace of 0.4 percent from 3.2 percent and 3.3 percent, respectively and in NCR, 0.3 percent from 2.9 percent. Among the regions in AONCR, the lowest rate of -1.5 percent was recorded in SOCCSKSARGEN.
-
The meat index in the Philippines and AONCR inched up 0.2 percent and in NCR, 0.4 percent as chicken were generally priced higher during the month.
-
Upward adjustments in the prices of off-season fruits particularly mango, avocado, apple and grape raised the group’s index in the Philippines and AONCR by 0.5 percent and 0.8 percent, respectively. On the other hand, the fruit index in NCR dropped by 1.1 percent due to price decreases in lanzones and dalanghita.
-
Prices of selected condiments and seasonings went down in most of the regions. Hence, the index for food products not elsewhere classified in AONCR dropped by 0.3 percent and in the Philippines, -0.1 percent. The group’s index in NCR however picked up 1.4 percent as some condiments and seasonings particularly calamansi and ginger were generally priced higher during the month.
-
-
Lower charges in electricity rates and downward price adjustments in kerosene in many regions pushed down the index for housing, water, electricity, gas, and other fuels in the three areas: Philippines, -0.4 percent; NCR, -1.1 percent; and AONCR, -0.2 percent.
-
The transport index at the national level and in AONCR went down by 0.2 percent and in NCR, -0.3 percent as prices of gasoline and diesel generally decreased during the month.
-
With higher prices of selected items for personal care and effects in some regions, the index for restaurant and miscellaneous goods and services in the Philippines and AONCR inched up 0.2 percent. Meanwhile, the group’s index in NCR recorded a zero growth during the period.
NOTES:
CPIs and inflation rates by province and selected city are also available upon request at NSO, Industry and Trade Statistics Department, Economic and Indicators Division (Telephone Numbers: 716-39-35 and 715-33-47).
(Sgd.) CARMELITA N. ERICTA
Administrator