
| Year-on-Year Inflation Rates, All Items | ||||
|---|---|---|---|---|
| Oct 2015 | Sep 2015 | Oct 2014 | Year-to-date | |
| Philippines | ||||
| Headline | 0.4 | 0.4 | 4.3 | 1.4 |
| Core | 1.5 | 1.4 | 3.2 | 2.0 |
| NCR | ||||
| Headline | 0.2 | 0.1 | 3.6 | 1.0 |
| AONCR | ||||
| Headline | 0.5 | 0.4 | 4.5 | 1.6 |
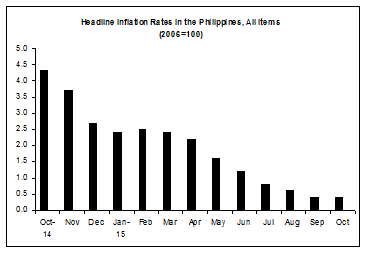
The year-on-year headline inflation at the national level was pegged at 0.4 percent in October. It was the same rate recorded last month while in October 2014, inflation reached 4.3 percent. Mixed movements in the annual growths were posted among the commodity groups. The indices for alcoholic beverages and tobacco; clothing and footwear; health; and transport exhibited higher annual rates while slowdowns were seen in the indices of food and non-alcoholic beverages; furnishing, household equipment and routine maintenance of the house; and recreation and culture. The index for housing, water, electricity, gas and other fuels continued to post annual decline. Growths for rest of the commodity groups remained at their previous month’s rates.
Excluding selected food and energy items, core inflation picked up by 1.5 percent in October. It was registered at 1.4 percent in September and 3.2 percent in October 2014.
-
Inflation in the National Capital Region (NCR) was however, higher at 0.2 percent in October due to faster annual increments in the indices of food and non-alcoholic beverages and transport. Last month, inflation was 0.1 percent and in October 2014, 3.6 percent.
-
Similarly, inflation in Areas Outside NCR (AONCR) moved up at a faster rate of 0.5 percent in October. It was posted at 0.4 percent last month and 4.5 percent in October 2014. Higher annual growths were observed in the indices of alcoholic beverages and tobacco; health; and restaurant and miscellaneous goods and services.
| Year-on-Year Inflation Rates in the Philippines, All Items January 2010 - October 2015 (2006=100) | ||||||
|---|---|---|---|---|---|---|
| Month | Year | |||||
| 2010 | 2011 | 2012 | 2013 | 2014 | 2015 | |
| January | 3.9 | 4.0 | 4.0 | 3.1 | 4.2 | 2.4 |
| February | 3.9 | 4.7 | 2.7 | 3.4 | 4.1 | 2.5 |
| March | 3.9 | 4.9 | 2.6 | 3.2 | 3.9 | 2.4 |
| April | 4.0 | 4.7 | 3.0 | 2.6 | 4.1 | 2.2 |
| May | 3.9 | 4.9 | 3.0 | 2.6 | 4.5 | 1.6 |
| June | 3.6 | 5.2 | 2.9 | 2.7 | 4.4 | 1.2 |
| July | 3.7 | 4.9 | 3.2 | 2.5 | 4.9 | 0.8 |
| August | 4.1 | 4.6 | 3.8 | 2.1 | 4.9 | 0.6 |
| September | 3.8 | 4.7 | 3.7 | 2.7 | 4.4 | 0.4 |
| October | 3.3 | 5.2 | 3.2 | 2.9 | 4.3 | 0.4 |
| November | 3.7 | 4.7 | 2.8 | 3.3 | 3.7 | |
| December | 3.6 | 4.2 | 3.0 | 4.1 | 2.7 | |
| Average | 3.8 | 4.6 | 3.2 | 3.0 | 4.1 | |
| Month-on-Month Inflation Rates, All Items (2006=100) | ||
|---|---|---|
| Oct 2015 | Sep 2015 | |
| Philippines | 0.1 | -0.2 |
| NCR | 0.2 | -0.4 |
| AONCR | 0.1 | -0.1 |
-
Prices of consumer items in the Philippines inched up 0.1 percent in October. This was primarily effected by higher prices of food items such as fish, fruits, meat, milk and cheese. Increases in ship fares and price mark-ups in gasoline, diesel and engine oil in most of the regions together with higher prices of meals eaten outside the home and some items for personal care in selected provinces also contributed to the uptrend.
CONSUMER PRICE INDEX
(2006=100)
OCTOBER 2015
By Region, Year-on-Year
- Inflation in NCR rose to 0.2 percent in October.
-
Inflation in AONCR likewise grew by 0.5 percent in October as seven regions had higher annual increments. The highest annual rate of 2.6 percent was still noted in ARMM while the lowest remained in Bicol Region at -0.8 percent.
By Commodity Group, Year-on-Year
-
A higher annual growth was registered in alcoholic beverages and tobacco index in the Philippines at 3.7 percent in October; clothing and footwear index, 2.2 percent; health index, 1.7 percent; and transport index, 0.1 percent. The other commodity groups had slower annual add-ons or retained their last month’s rates except for housing, water, electricity, gas and other fuels index which continued to post a negative rate of -2.1 percent.
The annual inflation in the country’s food alone index remained at its previous month’s rate of 0.7 percent. In October 2014, it was observed at 7.2 percent.
The annual growth in the meat index went up to 0.7 percent in October, fish and food products not elsewhere classified indices, 3.0 percent; vegetable index, 3.2 percent; and sugar, jam, honey, chocolate and confectionery index, 3.1 percent. Meanwhile, that for other cereals, flour, cereal preparation, bread, pasta and other bakery product index remained at 1.0 percent. The rest of the food groups had slower or negative annual rates.
-
In NCR, the annual gain in the heavily-weighted food and non-alcoholic beverages index was higher at 0.9 percent in October and transport index, 1.8 percent. The other commodity groups either had lower annual growths or retained their last month’s rates except for the index of housing, water, electricity, gas and other fuels which further dropped by 2.6 percent.
-
The food alone index in NCR moved up faster at 0.9 percent in October. It was recorded at 0.4 percent last month and 6.8 percent in October 2014
-
Faster annual increments were seen in the indices of meat; vegetables; and sugar, jam, honey, chocolate and confectionery. Meanwhile, the rest of the food groups either declined or had slower annual growths except the indices of milk, cheese and egg and oils and fats which retained their last month’s rates.
-
- In AONCR, the annual add-on in alcoholic beverages and tobacco index was higher at 4.0 percent in October; health index, 1.4 percent; and restaurant and miscellaneous goods and services index, 1.6 percent. However, annual upticks slowed down in the indices of food and non-alcoholic beverages at 0.7 percent and recreation and culture, 0.5 percent. The rest of the commodity groups either recorded annual decreases or retained their last month’s rate.
-
Movement in the food alone index in AONCR further improved to 0.7 percent in October. Last month, the index grew by 0.8 percent and in October 2014, 7.4 percent.
-
The rice index continued its downtrend as it moved by -2.2 percent in October. Annual drops were noted in twelve regions with Bicol Region still registering the lowest rate at -7.1 percent. On the other hand, the highest rate of 3.0 percent remained in ARMM.
-
Similarly, the indices of corn and oils and fats continued to post negative rates. Moreover, slower pace of increments were observed in the indices of milk, cheese and egg and fruit. The rest of the food groups had faster annual rates.
-
By Region, Month-on-Month
Compared to last month’s level, prices of consumer items in NCR generally went up by 0.2 percent in October. In September, the rate was seen at -0.4 percent. The indices for food and non-alcoholic beverages and clothing and footwear correspondingly picked up 0.5 percent and 0.1 percent. On the other hand, the transport index decelerated by 0.1 percent while the index for housing, water, electricity, gas and other fuels was still on the downtrend as it continued to show a negative rate at -0.2 percent. The rest of the commodity groups had zero growths.
Similarly, prices of consumer goods in AONCR moved upward by 0.1 percent in October after it shrank by 0.1 percent last month. This can be attributed to a higher growth in the heavily-weighted food and non-alcoholic beverages at 0.1 percent. Moreover, faster rates were also exhibited in the indices of alcoholic beverages and tobacco; transport; and restaurant and miscellaneous goods and services at 0.3 percent and furnishing, household equipment and routine maintenance of the house and health indices, 0.2 percent. The rest of the commodity groups either had zero growth or retained their last month’s rate.
Nine regions had higher rates with Western Visayas posting the highest rate of 0.8 percent. The lowest however, was in Ilocos Region and Northern Mindanao at -0.2 percent.
Among the three big areas of the country, prices of consumer items moved faster in Visayas compared to those in Luzon and Mindanao areas.
By Commodity Group, Month-on-Month
-
From a 0.2 percent decrease last month, consumer prices in the Philippines picked up 0.1 percent in October. This was primarily brought about by the 0.1 percent growth in the heavily-weighted food and non-alcoholic beverages index. Moreover, higher upticks were noted in the indices of alcoholic beverages and tobacco; clothing and footwear; health; and restaurant and miscellaneous goods and services. The rest of the commodity groups either retained their last month’s rates or had zero growths.
-
Price hikes in selected fish species pushed up the fish index in the three areas: Philippines, 0.8 percent; NCR, 3.1 percent; and AONCR, 0.4 percent. This was triggered by low supplies of fish in the markets as bad weather conditions which were experienced in many provinces limited fishing trips during the month.
-
Prices of off-season fruits particularly mango, pineapple and avocado were higher in most provinces. Prices of banana and canned fruits were also on the uptrend during the month. Hence, the fruit index in NCR rose 0.5 percent and AONCR, 1.4 percent. At the national level, the group’s index grew by 1.2 percent.
-
The meat index in AONCR inched up 0.3 percent as prices of fresh meat particularly beef went up during the period. Moreover, price add-ons in canned and processed meat were also noted in many provinces. On the other hand, lower prices of chicken and pork in NCR pushed down the meat index in the area by 0.1 percent. The group’s index in the Philippines exhibited a 0.1 percent growth during the month.
-
Upward adjustments in the prices of milk and egg in many provinces resulted to a 0.1 percent gain in the index for milk, cheese and egg in AONCR. However, the group’s index in NCR had a zero growth as prices of milk and cheese generally remained stable during the period. At the national level, the index for milk, cheese and egg inched up 0.1 percent.
-
Abundant supplies of ginger in the markets were noted due to the presence of newly harvested ginger. Ample supplies of calamansi in the markets were also noticed. Thus, prices of these food items decreased during the month. In addition, cheaper prices of selected sauces, condiments and seasonings were observed in many provinces. All these factors contributed to the 1.7 percent decline in the food products not elsewhere classified index in NCR and -0.8 percent in AONCR. In the Philippines, the group’s index dropped by 1.0 percent.
-
With the on-going harvest season for palay, nine regions had negative monthly rates in the rice index. In AONCR, the rice index moved down by 0.1 percent. On the contrary, the rice index in NCR gained by 0.1 percent due to higher prices of NFA and glutinous rice.The rice index at the national level fell by 0.1 percent.
-
-
The restaurant and miscellaneous goods and services index in AONCR rose 0.3 percent resulting from increments in the prices of meals eaten outside the home and some items for personal care in selected provinces. The group’s index in NCR however, recorded a zero growth during the month. The national index advanced by 0.2 percent.
-
The 0.3 percent growth in the transport index in AONCR and 0.1 percent in NCR was mainly attributed to the price mark-ups in gasoline, diesel and engine oil along with hikes in ship fares in many provinces. At the country level, the index gained 0.2 percent.
-
Lower charges in electricity rates in NCR pulled down the index for housing, water, electricity, gas, and other fuels in NCR by 0.2 percent. On the other hand, the group’s index in AONCR registered a zero growth due to the offsetting movements in electricity rates and prices of LPG and kerosene among the regions. In the Philippines, the group’s index had a zero growth.
Notes:
- The second phase survey reports for October 2015 from the following provinces/city were not received as of November 4, 2015:
- Zamboanga Sibugay
- Isabela City
- Basilan
- Sulu
- CPIs and inflation rates by province and selected city are also available upon request at Philippine Statistics Authority, Economic Sector Statistics Service, Price Statistics Division (Telephone Number: 376-19-59).
(Sgd.) LISA GRACE S. BERSALES, Ph.D.
National Statistician