
1. Philippines
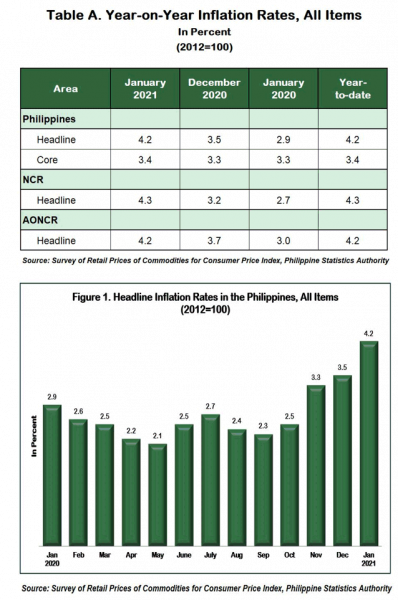
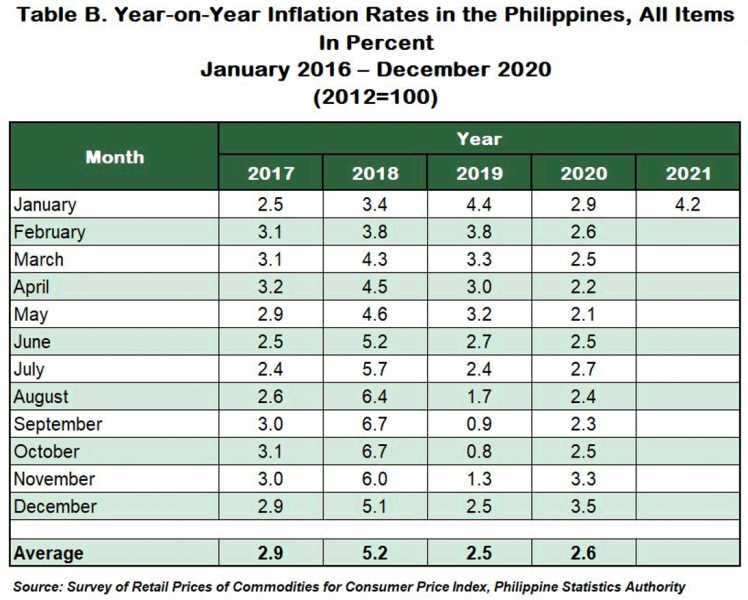
Headline inflation in the Philippines continued its uptrend as it went up further to 4.2 percent at the beginning of 2021. This is the highest inflation recorded since February 2019.
Inflation in December 2020 was posted at 3.5 percent, while in January 2020, 2.9 percent.
The overall inflation was primarily pushed up by the higher annual increment of the heavily-weighted food and non-alcoholic beverages at 6.2 percent during the month, from 4.8 percent in December 2020.
Also contributing to the uptrend in the country’s inflation were the higher annual increases in the indices of transport at 8.6 percent, and restaurant and miscellaneous goods and services at
Meanwhile, inflation decelerated in the indices of alcoholic beverages and tobacco at 11.7 percent, and furnishing, household equipment and routine maintenance of the house at 2.9 percent.
The rest of the commodity groups retained their previous month’s annual rates, except for recreation and culture whose annual rate decreased further by -0.7 percent during the month. (Tables 3 and 4)
Excluding selected food and energy items, core inflation picked up by 3.4 percent in January 2021. Core inflation in December 2020 and in January 2020 was both registered at 3.3 percent. (Tables A and 9)
Inflation for food index at the national level jumped to 6.6 percent in January 2021, from 4.9 percent in December 2020. In January 2020, inflation for food stood at 2.1 percent. (Table 7)
The indices of meat and vegetables both registered double-digit annual increments of 17.1 percent and 21.2 percent, respectively. In addition, faster annual increases were recorded in the indices of the following food groups:
- Corn, 1.6 percent;
- Other cereals, flour, cereal preparation, bread, pasta and other bakery products, 2.1 percent;
- Fish 3.7 percent;
- Oils and fats, 2.9 percent; and
- Fruits, 9.0 percent.
On the other hand, inflation were slower in the indices of sugar, jam, honey, chocolate and confectionery at 0.3 percent, and food products not elsewhere classified at 3.2 percent. The indices of rice; and milk, cheese and egg retained their corresponding previous month’s annual rates of 0.1 percent and 1.7 percent. (Tables 5)
2. National Capital Region (NCR)
Inflation in NCR rose to 4.3 percent in January 2021, from 3.2 percent in December 2020. Inflation in the area in January 2020 was posted at 2.7 percent. (Tables A and 3)
The 8.3 percent annual growth in food and non-alcoholic beverages index primarily pushed up the inflation in the area. In addition, the annual rate of housing, water, electricity, gas, and other fuels index picked up by 0.4 percent during the month, from an annual decline of -0.6 percent in December 2020. Higher double-digit annual hikes were also observed in the indices of alcoholic beverages and tobacco at 10.5 percent and transport at 11.3 percent.
The rest of the commodity groups either had slower annual increases or retained their previous month’s annual rates, except for recreation and culture whose annual rate declined further by -0.5 percent. (Tables 3 and 4)
3. Areas Outside NCR (AONCR)
Similar to the trend of the national level and NCR, inflation in AONCR went up further to 4.2 during the month, from 3.7 percent in December 2020. Inflation in the area in January 2020 was posted at 3.0 percent. (Tables A and 3)
The acceleration in the inflation in AONCR was mainly due to the 1.3 percentage points jump in the inflation of food and non-alcoholic beverages, registering at 5.8 percent during the month, from 4.5 percent in the previous month. Annual increments were also higher in the indices of transport at 7.8 percent, and restaurant and miscellaneous goods and services at 3.6 percent.
On the other hand, inflation slowed down for alcoholic beverages and tobacco at 12.0 percent; housing, water, electricity, gas, and other fuels, 0.5 percent; and furnishing, household equipment and routine maintenance of the house, 2.4 percent. Except for recreation and culture which exhibited an annual drop of -0.7 percent, the rest of the commodity groups retained their previous month’s annual growth rates during the period. (Table 3)
Twelve regions in AONCR exhibited higher inflation in January 2021. The highest inflation among the regions in AONCR during the month remained in Region II (Cagayan Valley) at 8.0 percent, while the lowest was recorded in Region IX (Zamboanga Peninsula) at 0.2 percent. (Table 4)
Note: CPIs and inflation rates by province and selected city are posted on the PSA website (http://openstat.psa.gov.ph/).
(Sgd) DENNIS S. MAPA, Ph.D.
Undersecretary
National Statistician and Civil Registrar General
See more at the CPI and Inflation Rate page.
| Attachment | Size |
|---|---|
|
|
601.48 KB |
|
|
246.27 KB |
|
|
35.05 KB |