YEAR-ON-YEAR
Philippines
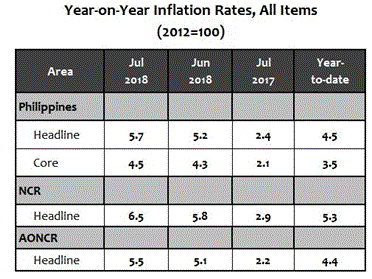
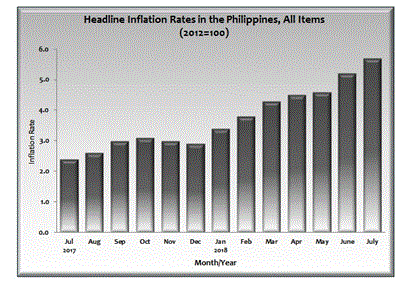
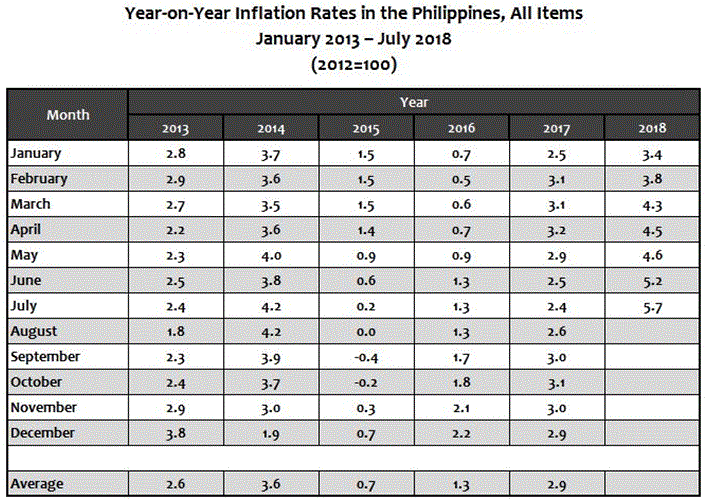
The country’s headline inflation rate continued to move at a faster pace of 5.7 percent in July 2018. In the previous month, inflation was posted at 5.2 percent and in June 2017, 2.4 percent.
The uptrend was mainly due to the 7.1 percent annual rate recorded in food and non-alcoholic beverages index. Nine out of 11 commodity divisions registered higher annual upticks during the month. (see Tables 3 and 4).
Excluding selected food and energy items, core inflation rate accelerated by 4.5 percent in July 2018. It was pegged at 4.3 percent in the previous month and 2.1 percent in July 2017 (see Table 9).
Similarly, the annual mark-up in the food alone index was higher at 6.8 percent in July 2018. Inflation in the previous month was observed at 5.8 percent and in July 2017, 2.9 percent (see Table 7).
Compared from their annual rates in June 2018, all the food groups posted higher annual increments in July 2018 except for the indices of corn and fruits (see Table 5).


National Capital Region (NCR)
Inflation in NCR was likewise, higher at 6.5 percent in July 2018. Inflation in the previous month was posted at 5.8 percent and in July 2017, 2.9 percent. Contibuting to the uptrend were the higher annual increases noted in the indices of the following commmmodity groups:
- Food and Non-Alcoholic Beverages, 7.2%;
- Alcoholic Beverages and Tobacco , 21.9%;
- Clothing and Footwear, 2.4%;
- Housing, Water, Electricity, Gas, and Other Fuels, 8.2%;
- Health, 4.5%;
- Transport, 8.9%;
- Communication, 0.6%; and
- Recreation and Culture, 1.1%.
The rest of the commodity groups either moved up at a slower pace or retained their previous month’s rate (see Tables 3 and 4).
Areas Outside NCR (AONCR)
In AONCR, inflation went up by 5.5 percent in July 2018. In the previous month, inflation was observed at 5.1 percent and in July 2017, 2.2 percent.
Faster annual mark-ups were recorded in all the commodity groups, except for the indices of recreation and culture, and education. Inflation for recreation and culture index decelerated to 0.8 percent while that for the education index dropped by 5.8 percent (see Tables 3 and 4).
Compared with the previous month’s inflation, 11 regions posted higher annual rates during the month. The highest inflation of 7.5 percent was still noted in ARMM (Autonomous Region in Muslim Mindanao) while the lowest rate of 2.7 percent remained in Region III (Central Luzon) (see Table 4).
Notes:
- The second phase survey reports from Sulu and Basilan were not received as of 04 July 2018.
- Price movements of the commodities from the sample municipalities of Lanao del Sur were used to impute the prices for Marawi City for July 2018.
- CPIs and inflation rates by province and selected city are also available upon request at Price Statistics Division (Telephone Number: 376-19-59).
(Sgd) LISA GRACE S. BERSALES, Ph.D.
Undersecretary
National Statistician and Civil Registrar General
See more at the CPI and Inflation Rate page.
