
1. Philippines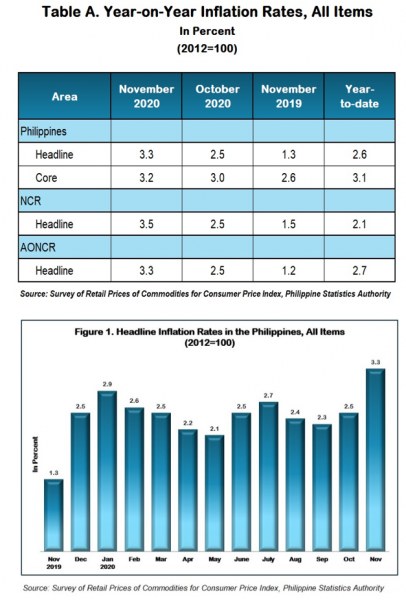
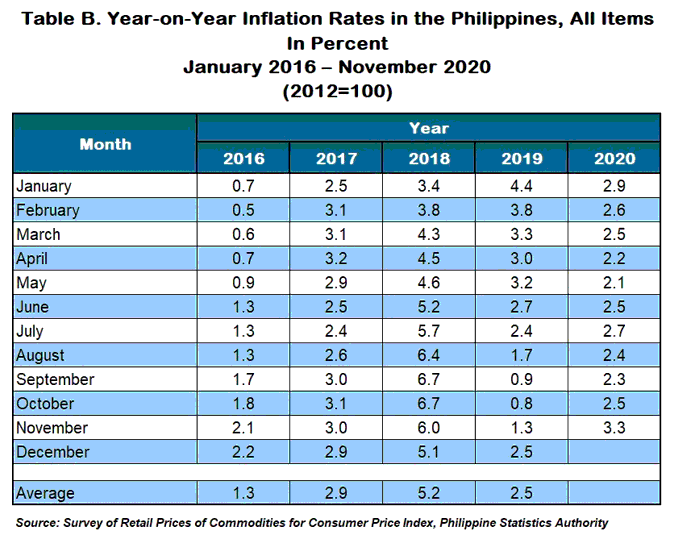
The Philippines’ headline inflation jumped to 3.3 percent in November 2020 from 2.5 percent in October 2020. This is the highest inflation registered since April 2019.
Inflation in November 2019 was recorded at 1.3 percent.
The country’s year-to-date inflation for the year 2020 was posted at 2.6 percent.
The annual increase of 4.3 percent in the heavily-weighted food and non-alcoholic beverages primarily pushed up the overall inflation in November 2020.
Contributing also to the uptrend in the overall inflation during the month was the higher annual increment noted in alcoholic beverages and tobacco at 12.3 percent.
Meanwhile, annual mark-ups decelerated in the indices of the rest of the commodity groups, except for recreation and culture whose annual rate remained at -0.6 percent. (Table 3)
Similarly, core inflation moved up at a faster pace of 3.2 percent in November 2020 from 3.0 percent in the previous month. In November 2019, core inflation was observed at 2.6 percent.
Inflation for food index at the national level picked up further to 4.5 percent in November 2020, from
The index for vegetables exhibited a double-digit annual increment of 14.6 percent during the month, after registering an annual drop of -0.5 percent in the previous month. Moreover, annual hikes were higher in the indices of the following food groups:
- Meat, 8.2 percent;
- Fish, 5.3 percent;
- Fruits, 5.6 percent; and
- Sugar, jam, honey, chocolate and confectionery, 0.4 percent.
On the other hand, slower annual gains were posted in the indices of the following food groups:
- Other cereals, flour, cereal preparation, bread, pasta and other bakery products, 2.1 percent;
- Milk, cheese and egg, 1.8 percent; and
- Food products, not elsewhere classified, 4.5 percent.
The index for rice exhibited an annual decrease of -0.1 percent, while those for corn; and oils and fats retained their previous month’s annual rates. (Table 5)
2. National Capital Region (NCR)
Inflation in NCR, likewise, picked up to 3.5 percent in November 2020 from 2.5 percent in the previous month. Inflation in the region in November 2019 was noted at 1.5 percent. (Tables A and 3)
Uptrend in the November 2020 inflation in NCR was mainly driven by the 6.2 percent annual growth rate in food and non-alcoholic beverages. Higher annual increases in the indices of alcoholic beverages and tobacco at 8.5 percent, and communication at 0.3 percent, also contributed to the higher inflation in the region during the month.
On the other hand, annual gains decelerated in the indices of the following commodity groups:
- Furnishing, household equipment and routine maintenance of the house, 5.3 percent;
- Transport, 10.9 percent;
- Education, 0.5 percent; and
- Restaurant and miscellaneous goods and services, 1.4 percent.
Moreover, the annual growth rate of recreation and culture index declined further to -0.2 percent. Likewise, housing, water, electricity, gas and other fuels went down at an annual rate of -0.2 percent during the month.
Meanwhile, the indices for clothing and footwear, and health retained their previous month’s annual growth rates of 1.1 percent and 3.0 percent, respectively. (Tables 3 and 4)
3. Areas Outside NCR (AONCR)
Similar to the trend at the national level and in NCR, inflation in AONCR accelerated to 3.3 percent in November 2020 from 2.5 percent in October 2020. Inflation in these areas in November 2019 stood at 1.2 percent. (Tables A and 3)
Higher inflation in AONCR was mainly brought about by the 3.8 percent yearly growth recorded in the index for food and non-alcoholic beverages during the month. Annual increases were also higher in the indices of alcoholic beverages and tobacco at 13.0 percent; and housing, water, electricity, gas, and other fuels at 1.2 percent.
However, lower annual mark-ups were posted in the indices of the rest of the commodity groups, except for education which retained its previous month’s annual rate of 1.4 percent, and recreation and culture which declined by -0.8 percent.
Relative to their annual growth rates in October 2020, inflation rates during the month for AONCR were higher in all regions in Luzon, Region VI (Western Visayas), and Bangsamoro Autonomous Region in Muslim Mindanao (BARMM). The highest inflation during the month remained in Region V (Bicol Region) at 5.5 percent, while the lowest was still observed in Region VII (Central Visayas) at 1.1 percent. (Table 4)
Note: CPIs and inflation rates by province and selected city are posted on the PSA website (http://openstat.psa.gov.ph/).
(Sgd) DENNIS S. MAPA, Ph.D.
Undersecretary
National Statistician and Civil Registrar General
See more at the CPI and Inflation Rate page.
| Attachment | Size |
|---|---|
|
|
472.87 KB |
|
|
244.26 KB |
|
|
34.84 KB |