
A. EXPORTS
1. Works of art, collectors’ pieces and antiques was the primary driver to the slower annual increment of UVI for Exports
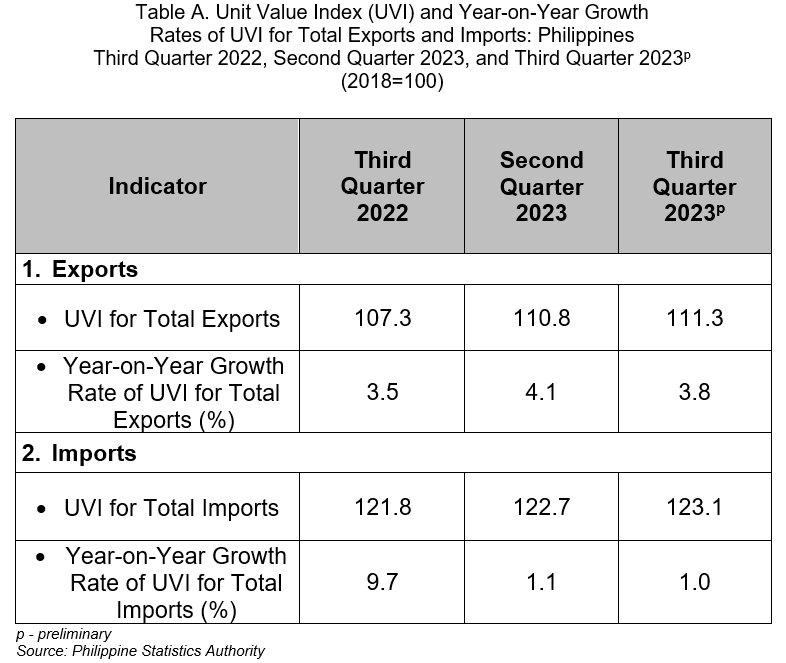
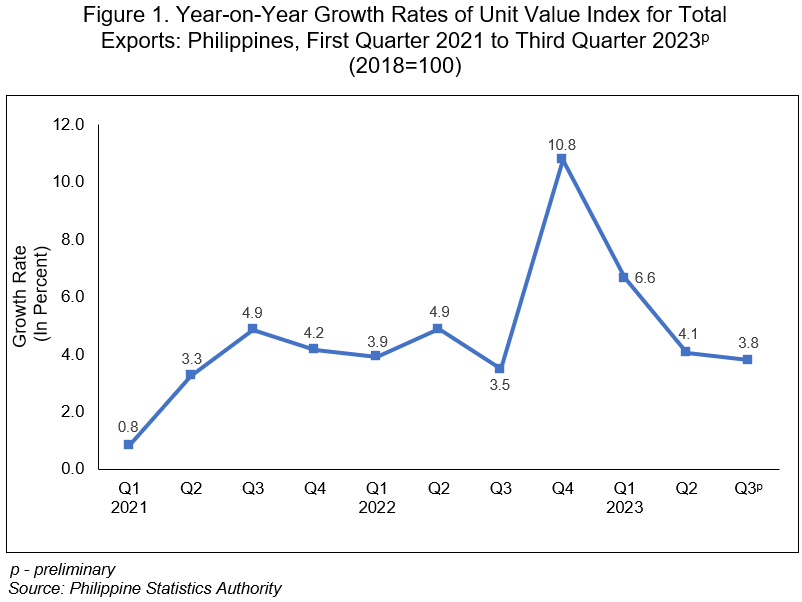
The Unit Value Index (UVI) of exported goods for the third quarter of 2023 registered a slower annual growth rate of 3.8 percent from the 4.1 percent annual increase in the previous quarter. UVI for exports grew by 3.5 percent in the third quarter of 2022. (Figure 1, and Tables A and 2)
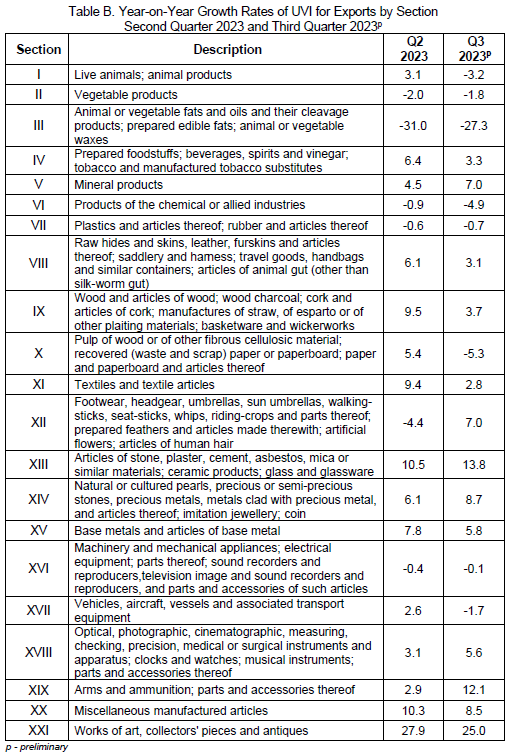
The deceleration in the annual growth rate of UVI in the third quarter of 2023 relative to its annual increase in the second quarter of 2023 was mainly brought about by works of art, collectors’ pieces and antiques with a slower annual increment of 25.0 percent in the third quarter of 2023 from an annual increase of 27.9 percent in the previous quarter. This section contributed 41.3 percent to the slower annual growth rate of UVI in the third quarter of 2023.
Other main contributors to the slower annual growth rate of UVI for exports in the third quarter of 2023 were the annual decline observed in vehicles, aircraft, vessels and associated transport equipment at 1.7 percent in the third quarter of 2023 from a 2.6 percent annual increase in the second quarter of 2023, and the slower annual increment recorded in prepared foodstuffs; beverages, spirits and vinegar; tobacco and manufactured tobacco substitutes at 3.3 percent in the third quarter of 2023 from 6.4 percent in the previous quarter.
Of the remaining 18 sections, 11 exhibited annual increases, while seven posted annual decreases in the third quarter of 2023. (Tables A, B, and 2)
2. Works of art, collectors’ pieces and antiques was the main contributor to the overall annual growth rate of UVI for Exports
The top three sections contributing to the overall annual growth rate of UVI for exports in the third quarter of 2023 were the following:
a. Works of art, collectors’ pieces and antiques (25.0%);
b. Base metals and articles of base metal (5.8%); and
c. Mineral products (7.0%). (Tables B and 2)
B. IMPORTS
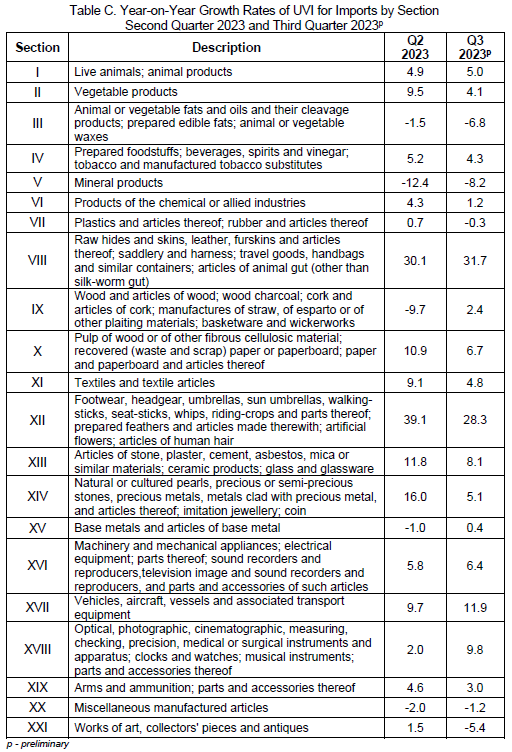
1. Works of art, collectors’ pieces and antiques was the primary driver to the slowdown of UVI for Imports
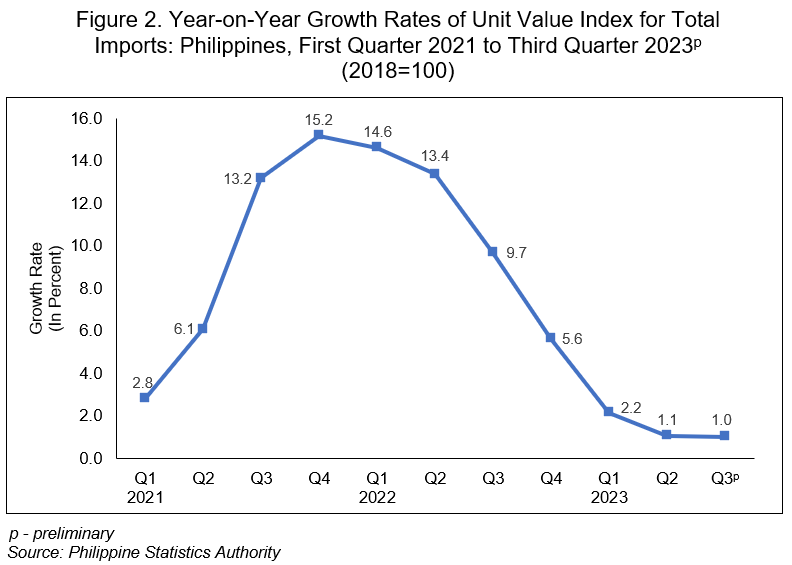
The UVI of imported goods registered an annual growth rate of 1.0 percent in the third quarter of 2023. This indicates a slowdown from the annual increase of 1.1 percent recorded in the second quarter of 2023. UVI for imports recorded an annual increase of 9.7 percent in the third quarter of 2022. (Figure 2, and Tables A and 4)
The slower annual growth rate of UVI for imports in the third quarter of 2023 was mainly contributed by the annual decrease recorded in works of art, collectors’ pieces and antiques at 5.4 percent from an annual increment of 1.5 percent in the second quarter of 2023. This section contributed 53.0 percent to the slower annual growth rate of UVI for imports in the third quarter of 2023.
Completing the top three contributors to the slower annual rate of UVI for imports during the period were the slower annual increments in products of the chemical or allied industries at 1.2 percent in the third quarter of 2023 from 4.3 percent in the second quarter of 2023, and vegetable products at 4.1 percent in the third quarter of 2023 from 9.5 percent in the second quarter of 2023.
Of the remaining 18 sections, 14 sections registered annual increases, while four recorded annual declines in the third quarter of 2023. (Tables A, C, and 4)
2. Machinery and mechanical appliances; electrical equipment; parts thereof; sound recorders and reproducers, television image and sound recorders and reproducers, and parts and accessories of such articles was the main contributor to the overall annual growth rate of UVI for Imports
The top three sections contributing to the overall annual growth rate of UVI for imports in the third quarter of 2023 were the following:
a. Machinery and mechanical appliances; electrical equipment; parts thereof; sound recorders and reproducers, television image and sound recorders and reproducers, and parts and accessories of such articles (6.4%);
b. Vehicles, aircraft, vessels and associated transport equipment (11.9%); and
c. Prepared foodstuffs; beverages, spirits and vinegar; tobacco and manufactured tobacco substitutes (4.3%). (Tables C and 4)
CLAIRE DENNIS S. MAPA, PhD
Undersecretary
National Statistician and Civil Registrar General
| Attachment | Size |
|---|---|
|
|
874.64 KB |
|
|
39.83 KB |
|
|
190.12 KB |