

A. TOTAL EXTERNAL TRADE AND BALANCE OF TRADE
1. Total external trade decreased by 1.2 percent
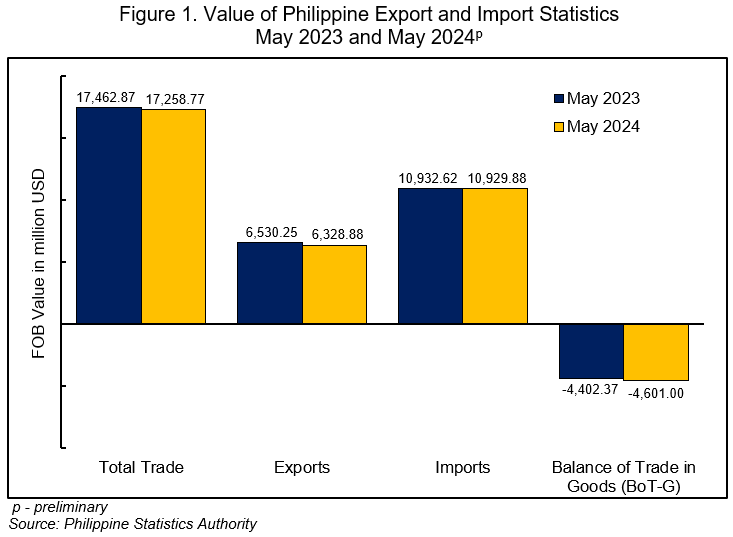
In May 2024, the country’s total external trade in goods amounted to USD 17.26 billion, which indicates an annual decrease of 1.2 percent from the USD 17.46 billion total external trade in the same period of the previous year. In April 2024, the total external trade in goods registered an annual increase of 18.0 percent, while an annual decline of 4.2 percent was registered in May 2023. (Figure 1, and Tables A and 1)
Of the total external trade in May 2024, 63.3 percent were imported goods, while the remaining were exported goods.
2. Trade deficit posted an annual increase
The balance of trade in goods (BoT-G) is the difference between the value of exports and imports. The BoT-G in May 2024 amounted to USD -4.60 billion, indicating a trade deficit with an annual increase of 4.5 percent. In April 2024 and May 2023, the trade deficit recorded annual declines of 2.1 percent and 20.3 percent, respectively. (Figure 1, and Tables A and 4)
B. EXPORTS
1. Sales from export posted a negative growth
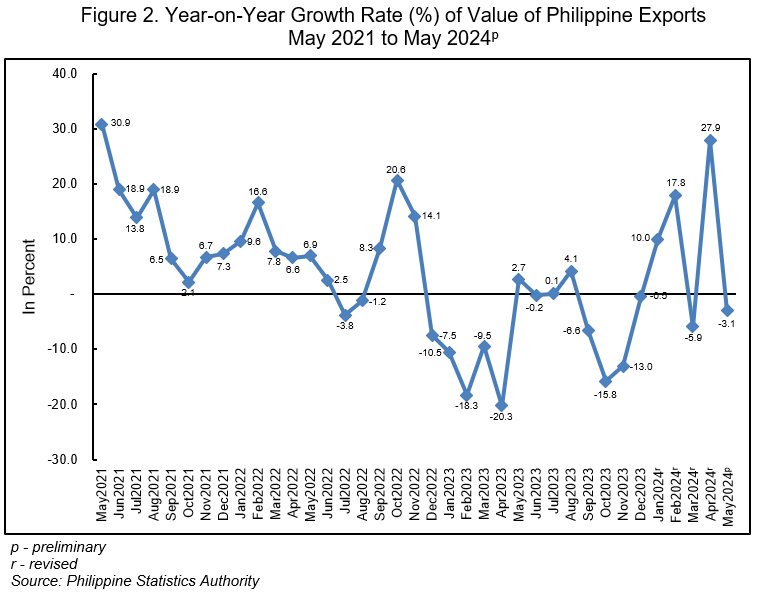
The country’s total export sales in May 2024 amounted to USD 6.33 billion, indicating an annual decrease of 3.1 percent from the USD 6.53 billion total exports in the same month of the previous year. In April 2024 and May 2023, the total exports registered annual increases of 27.9 percent and 2.7 percent, respectively. (Figures 1 and 2, and Tables A and 3)
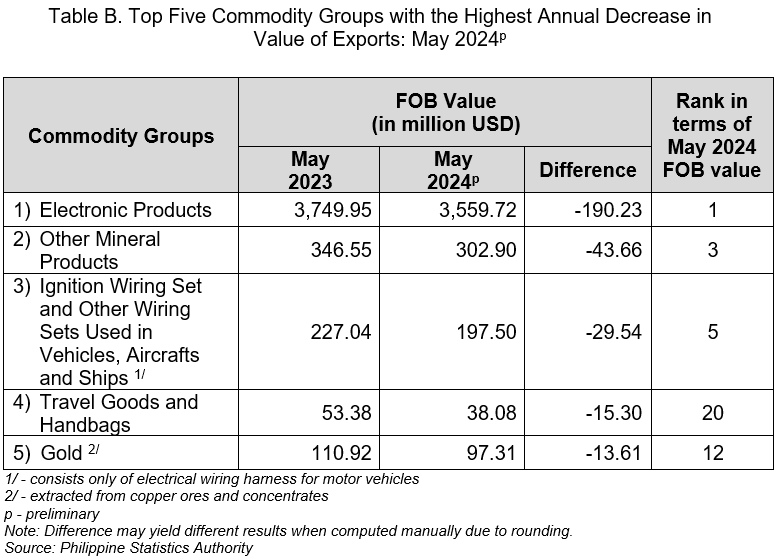
The commodity group with the highest annual decrement in the value of exports in May 2024 was electronic products with USD 190.23 million. This was followed by other mineral products with an annual decrease of USD 43.66 million, and ignition wiring set and other wiring sets used in vehicles, aircrafts and ships with an annual decline of USD 29.54 million. (Tables B and 5)
2. Year-to-date annual total exports increased
The year-to-date annual total value of exports, that is from January to May 2024, amounted to USD 30.84 billion. This represents an annual increase of 7.8 percent from the year-to-date annual total export value of USD 28.61 billion in January to May 2023. (Tables 3 and 6)
3. Electronic products commodity group remained the highest on export sales
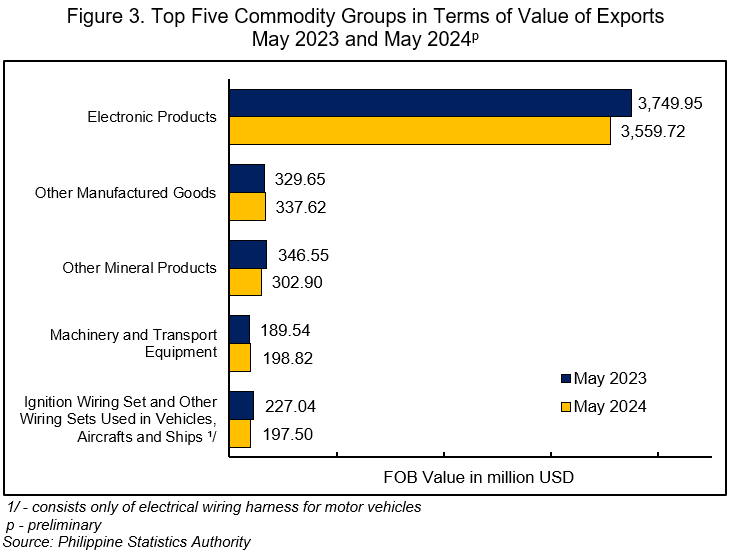
By commodity group, electronic products continued to be the country’s top exports in May 2024 with total earnings of USD 3.56 billion or 56.2 percent of the country’s total exports during the period. This was followed by other manufactured goods with an export value of USD 337.62 million (5.3%), and other mineral products with USD 302.90 million (4.8%). (Figure 3 and Table 5)
4. Manufactured goods still comprised the largest portion of total exports among major types of goods
By major type of goods, exports of manufactured goods contributed the largest to the country’s total exports in May 2024 amounting to USD 5.08 billion or a share of 80.3 percent. This was followed by mineral products with a share of USD 633.63 million (10.0%), and total agro-based products, which contributed USD 468.32 million (7.4%). (Figure 4 and Table 7)

5. United States of America (USA) contributed the highest to the total export value
By major trading partner, exports to United States of America (USA) comprised the highest export value amounting to USD 1.08 billion or a share of 17.0 percent to the country’s total exports in May 2024.
Completing the top five major export trading partners for this month with their export values and percent shares to the total exports were:
a. Hong Kong, USD 904.79 million (14.3%);
b. Japan, USD 882.70 million (13.9%);
c. People’s Republic of China, USD 847.12 million (13.4%); and
d. Thailand, USD 267.14 million (4.2%). (Figure 5 and Table 9)

6. Majority of exports were for Asia-Pacific Economic Cooperation (APEC) countries
By economic bloc, majority of the country’s merchandise exports in May 2024 went to APEC countries with a share of USD 5.31 billion or 83.9 percent of the country’s total exports. This was followed by East Asia at USD 3.17 billion (50.0%), and Regional Comprehensive Economic Partnership (RCEP), valued at USD 2.95 billion (46.6%). (Figure 6, and Tables 10 and 18)

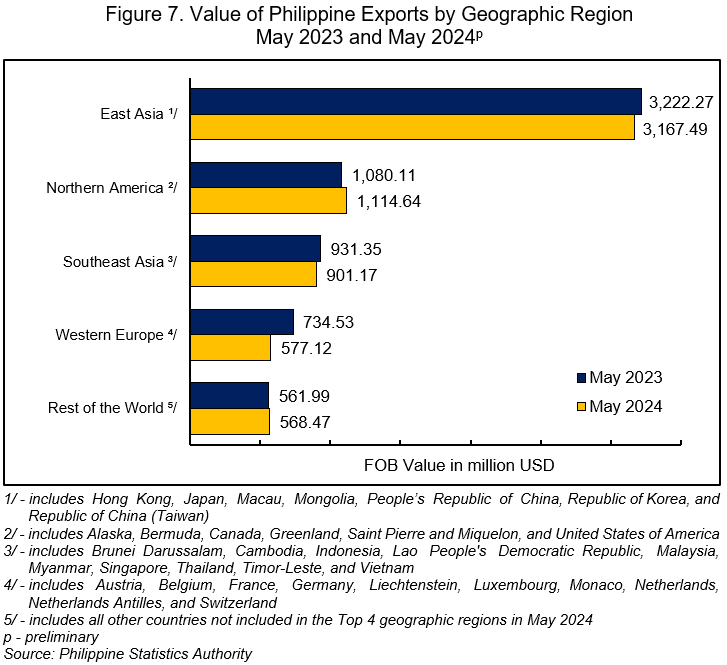
7. East Asia contributed the highest export value by geographic region
By geographic region, East Asia comprised the highest export value in May 2024 amounting to USD 3.17 billion (50.0%). This was followed by Northern America with an export value of USD 1.11 billion (17.6%), and Southeast Asia with USD 901.17 million (14.2%) worth of exports. (Figure 7 and Table 19)
C. IMPORTS
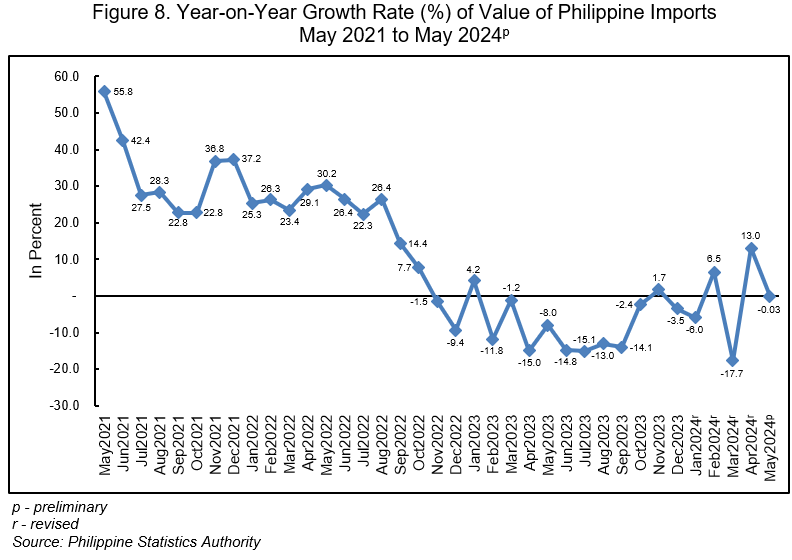
1. Import value decreased in May 2024
The total imported goods in May 2024 amounted to USD 10.930 billion, indicating an annual decrease of 0.03 percent from the USD 10.933 billion import value in the same month of the previous year. In April 2024, the import value recorded an annual increase of 13.0 percent, while in May 2023, it exhibited an annual decline of 8.0 percent. (Figures 1 and 8, and Tables A and 2)
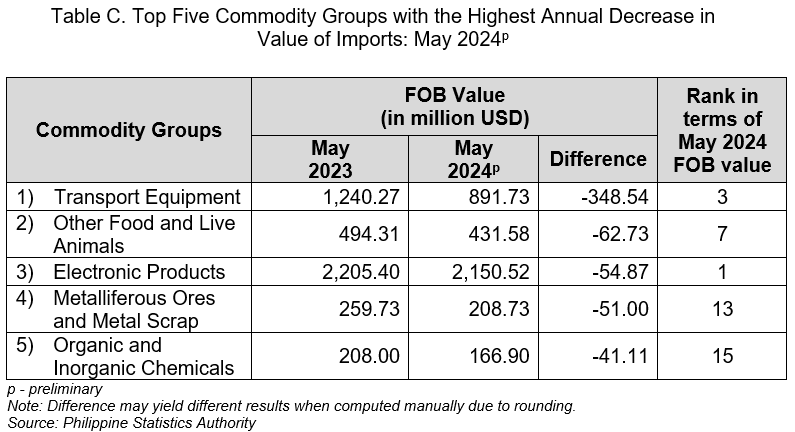
In May 2024, the commodity group with the highest annual decrement in the value of imported goods was transport equipment with USD 348.54 million. This was followed by other food and live animals, which decreased by USD 62.73 million, and electronic products with an annual decline of USD 54.87 million. (Tables C and 11)
2. Year-to-date annual total import value decreased
The year-to-date annual total import value, that is from January to May 2024, amounted to USD 51.43 billion. This represents an annual decrement of 1.7 percent from the year-to-date annual total import value of USD 52.29 billion in January to May 2023. (Tables 2 and 12)
3. Electronic products recorded the highest import value among commodity groups
The commodity group with the highest import value in May 2024 was electronic products, which amounted to USD 2.15 billion or a share of 19.7 percent to the country’s total imports. This was followed by mineral fuels, lubricants and related materials at USD 1.85 billion (17.0%), and transport equipment at USD 891.73 million (8.2%). (Figure 9 and Table 11)

4. Imports of raw materials and intermediate goods contributed the highest among major types of goods
By major type of goods, imports of raw materials and intermediate goods accounted for the largest share of the country’s total imports in May 2024 amounting to USD 4.09 billion (37.4%). This was followed by capital goods with a share of USD 2.80 billion (25.6%), and consumer goods with an import value of USD 2.14 billion (19.6%). (Figure 10 and Table 13)

5. People’s Republic of China had the highest import value
People’s Republic of China was the country’s largest supplier of imported goods valued at USD 2.73 billion or 25.0 percent of the country’s total imports in May 2024.
Completing the top five major import trading partners for this month with their corresponding import values and percent shares to the total imports were:
a. Republic of Korea, USD 989.60 million (9.1%);
b. Indonesia, USD 972.15 million (8.9%);
c. USA, USD 748.19 million (6.8%); and
d. Thailand, USD 707.44 million (6.5%). (Figure 11 and Table 15)

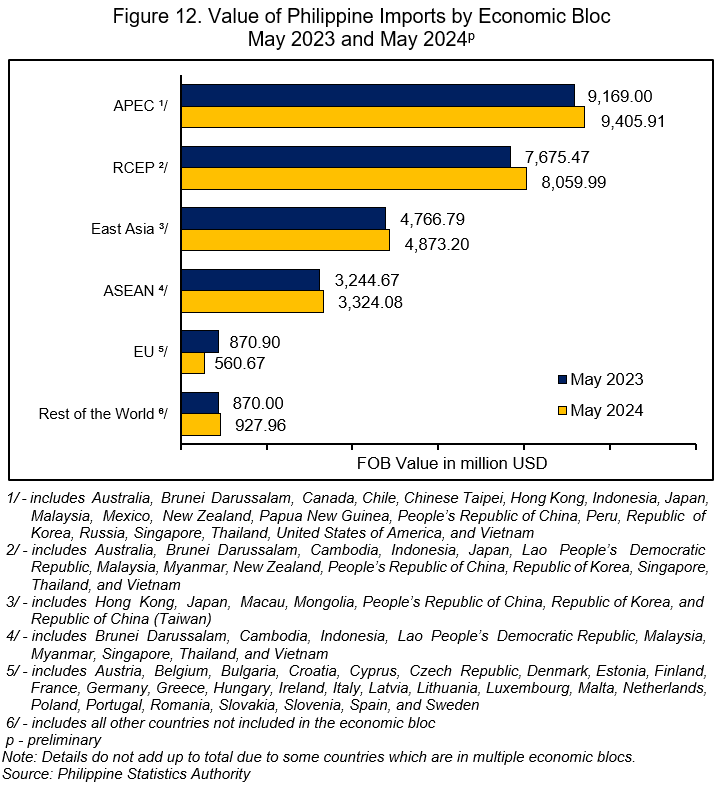
6. Imports came largely from APEC member countries
By economic bloc, APEC countries were the largest suppliers of the country’s imported goods in May 2024 with a share of USD 9.41 billion (86.1%). This was followed by RCEP with an import value of USD 8.06 billion (73.7%), and East Asia with USD 4.87 billion (44.6%). (Figure 12, and Tables 16 and 18)
7. East Asia contributed the highest import value among geographic regions
By geographic region, East Asia had the highest import value of USD 4.87 billion (44.6%) in May 2024. This was followed by Southeast Asia with an import value amounting to USD 3.32 billion (30.4%), and Northern America valued at USD 851.73 million (7.8%). (Figure 13 and Table 19)

CLAIRE DENNIS S. MAPA, PhD
Undersecretary
National Statistician and Civil Registrar General
See more at the Export and Import Statistics landing page.
| Attachment | Size |
|---|---|
|
|
414.61 KB |
|
|
136.8 KB |
|
|
191.48 KB |