MAY 2019
YEAR-ON-YEAR
Philippines
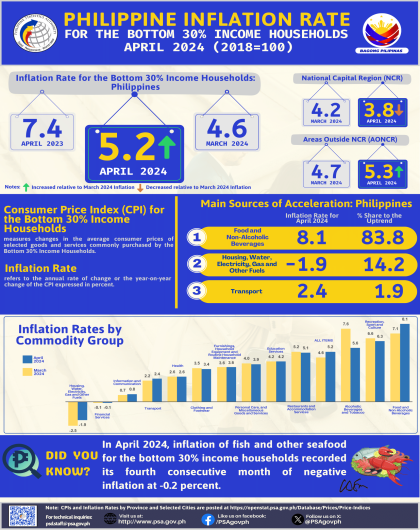
The country’s year-on-year inflation for bottom 30% income households went up by 4.6 percent in May 2019 after six consecutive months of deceleration.
In April 2019, inflation was registered at 4.3 percent and in May 2018, 6.4 percent.
Contributing to the uptrend were the higher annual rates observed in the indices of food, beverages and tobacco (FBT) at 4.8 percent; clothing, 3.2 percent; and miscellaneous, 2.5 percent. On the other hand, the indices of housing and repairs (H&R); and fuel, light and water (FLW) recorded slower annual increases of 4.1 percent and 3.9 percent, respectively. The services index retained its previous month’s annual rate of 3.7 percent (see Tables 3 and 4).
The annual change of food index at the national level picked up by 4.3 percent during the month. Its annual rate was posted at 3.9 percent in April 2019 and 6.2 percent in May 2018 (see Tables 5 and 7).
Annual hikes were higher in the indices of the following food groups:
- Dairy products, 3.3%;
- Fish, 7.8%;
- Fruits and vegetables, 9.9%; and
- Miscellaneous foods, 5.0%.
On the contrary, slower annual gains were posted in the indices of rice at 1.9 percent; eggs, 2.3 percent; and meat, 2.4 percent. The index of corn continued to exhibit downward movement as it recorded a 1.8 percent drop during the month, while the cereal preparations index retained its previous month’s annual change of 3.9 percent (see Table 5).
| Year-on-Year Inflation Rates of the CPI for Bottom 30% Income Households in the Philippines, All Items January 2015 – May 2019 (2000=100) In Percent | |||||
|---|---|---|---|---|---|
| Month | Year | ||||
| 2015 | 2016 | 2017 | 2018 | 2019 | |
| January | 3.8 | 1.0 | 2.4 | 4.7 | 5.9 |
| February | 2.9 | 1.0 | 3.0 | 5.4 | 5.0 |
| March | 2.6 | 1.2 | 3.0 | 5.8 | 4.6 |
| April | 2.5 | 1.0 | 2.9 | 6.3 | 4.3 |
| May | 2.1 | 1.1 | 2.6 | 6.4 | 4.6 |
| June | 1.5 | 1.4 | 2.6 | 6.7 | |
| July | 0.8 | 1.3 | 2.7 | 7.6 | |
| August | 0.4 | 1.3 | 3.0 | 8.3 | |
| September | 0.1 | 1.6 | 3.3 | 9.5 | |
| October | 0.4 | 1.7 | 3.4 | 9.5 | |
| November | 0.9 | 2.0 | 3.4 | 8.3 | |
| December | 1.1 | 2.1 | 3.7 | 7.2 | |
| Average | 1.6 | 1.4 | 3.0 | 7.2 | |
National Capital Region (NCR)
Inflation for the bottom 30% income households in NCR at 2.6 percent in May 2019 was the same annual rate posted in the previous month. In May 2018, inflation was recorded at 6.3 percent. Annual rates in the indices of FBT remained at 2.5 percent, services, 3.3 percent; and miscellaneous, 2.1 percent.
Annual increments were higher in the indices of clothing at 1.4 percent and H&R at 1.2 percent. On the other hand, the FLW index had a slower annual increase of 3.2 percent (see Tables 3 and 4).
Inflation of the food index during the month retained its previous month’s annual rate of 2.2 percent. Inflation of the group’s index was higher at 5.6 percent in May 2018 (see Tables 5 and 7).
Higher annual mark-ups were posted in the indices of cereal preparations at 4.1 percent; eggs, 7.9 percent; and fruits and vegetables, 9.5 percent. On the contrary, the following indices registered slower annual rates during the month:
- Dairy products, 5.7%;
- Fish, 1.8%;
- Meat, 3.1%; and
- Miscellaneous foods, 1.5%.
Meanwhile, the indices of rice and corn continued to register annual declines of 4.1 percent and 0.2 percent, respectively (see Table 5).
Areas Outside NCR (AONCR)
Inflation for bottom 30% income households in AONCR followed the same trend as the national level as it went up by 4.6 percent in May 2019. In the previous month, its annual change was recorded at 4.3 percent and in May 2018, 6.5 percent.
Higher annual mark-ups were observed in the indices of FBT and miscellaneous at 4.9 percent and 2.5 percent, respectively. Meanwhile, annual increases in the indices of H&R and FLW correspondingly decelerated to 4.1 percent and 3.9 percent. Moreover, clothing and services indices retained their corresponding previous month’s annual rates of 3.2 percent and 3.7 percent (see Tables 3 and 4).
Relative to their annual increments in the previous month, 12 regions outside NCR exhibited higher annual rates in May 2019. The highest annual inflation of 10.3 percent remained in MIMAROPA Region while the lowest was noted in Eastern Visayas at 2.4 percent (see Table 4).
The food index in AONCR posted a higher annual gain of 4.4 percent during the month. Its annual rate settled to 4.0 percent in the previous month and 6.3 percent in the same month of the previous year (see Tables 5 and 7).
Annual hikes were higher in the following food groups during the month:
- Dairy products, 3.2%;
- Fish, 7.9%;
- Fruits and vegetables, 9.9%; and
- Miscellaneous foods, 5.1%.
The cereal preparations index retained its previous month’s annual growth of 3.9 percent, while a downtrend was still posted in the annual movement of the corn index as it declined by 1.8 percent during the month. The other food groups had slower annual rates during the month (see Table 5).
Note:
Monthly CPIs for the bottom 30% income households by province and selected cities are posted at the PSA website (http://openstat.psa.gov.ph/).
See more at the Consumer Price Index for Bottom 30% Income Households Main page.