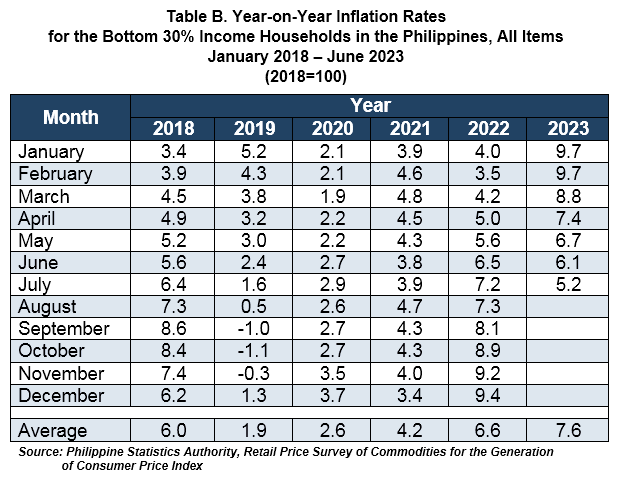
Table A. Year-on-Year Inflation Rates
for the Bottom 30% Income Households, All Items
In Percent
(2018=100)
|
|
|
|
|
|---|---|---|---|---|
| Philippines | 7.2 | 6.1 | 5.2 | 7.6 |
| NCR | 5.3 | 6.6 | 6.6 | 8.1 |
| AONCR | 7.2 | 6.0 | 5.1 | 7.6 |
| Source: Philippine Statistics Authority, Retail Price Survey of Commodities for the Generation of Consumer Price Index *Year-on-year change of average CPI for January to July 2022 vs. 2023 | ||||
A. Philippines
1. Overall Inflation
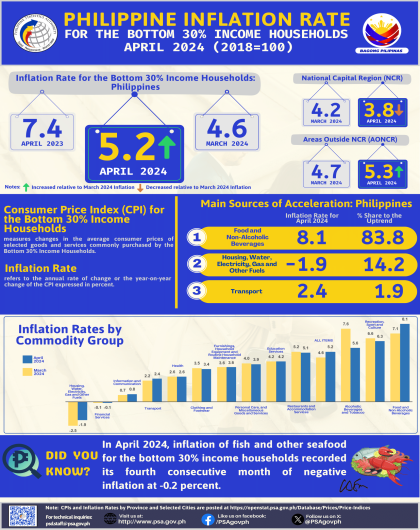
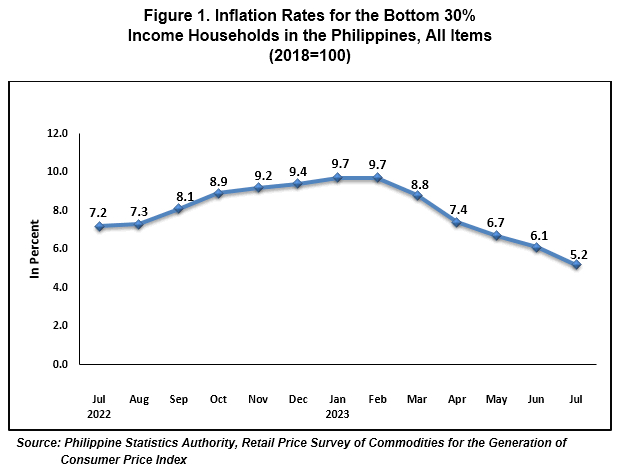
The Philippine’s overall inflation for the bottom 30% income households continued to exhibit a downward trend as it decelerated further to 5.2 percent in July 2023 from 6.1 percent in the previous month. This is the lowest inflation observed since April 2022 with an inflation rate of 5.0 percent. This brings the national average inflation rate from January to July 2023 for this group of consumers to 7.6 percent. In July 2022, the headline inflation for this income group was higher at 7.2 percent. (Figure 1, and Tables A, B, 5, 6, and 12)
1.1 Main Drivers to the Downward Trend of the Overall Inflation
The main driver of the continued downtrend of the overall inflation in July 2023 was the lower year-on-year increase in the heavily-weighted food and non-alcoholic beverages at 6.1 percent in July 2023 from 6.9 percent in the previous month. This was followed by housing, water, electricity, gas and other fuels, which posted an annual mark-up of 3.0 percent during the month from 4.8 percent in June 2023. The third main driver to the slowdown was transport, which exhibited an annual decline of -3.0 percent from -1.2 percent in the previous month.
In addition, slower annual upticks were registered in the indices of the following commodity groups in July 2023:
a. Alcoholic beverages and tobacco, 11.2 percent from 12.0 percent;
b. Clothing and footwear, 5.2 percent from 5.4 percent;
c. Furnishings, household equipment and routine household maintenance, 6.0 percent from 6.3 percent;
d. Health, 3.4 percent from 3.7 percent;
e. Restaurants and accommodation services, 7.6 percent from 7.8 percent; and
f. Personal care, and miscellaneous goods and services, 6.0 percent from 6.2 percent.
On the other hand, faster annual increases were posted in the indices of recreation, sport and culture at 6.0 percent in July 2023 from 5.8 percent in the previous month; and education services at 3.3 percent from 3.2 percent. The indices of the rest of the commodity groups moved at their respective previous month’s annual rates. (Tables 5 and 6)
1.2 Main Contributor to the Overall Inflation
The following commodity groups were the top three contributors to the July 2023 overall inflation for the bottom 30% income households:
a. Food and non-alcoholic beverages, 64.8 percent share or 3.4 percentage points;
b. Restaurants and accommodation services, 11.0 percent share or 0.6 percentage point; and
c. Housing, water, electricity, gas and other fuels, 9.0 percent share or 0.5 percentage point.
2. Food Inflation
The food inflation for the bottom 30% income households decelerated further to 6.1 percent during the month from 7.0 percent in June 2023, marking the fifth consecutive month of lower inflation for this income group. In July 2022, food inflation stood at 7.1 percent. (Table 9)
2.1 Main Drivers to the Downward Trend of the Food Inflation
The lower annual growth of fish and other seafood at 4.4 percent in July 2023 from 6.5 percent in June 2023 primarily pulled down the food inflation for this income group. Meat and other parts of slaughtered land animals followed with an annual decline of -1.1 percent in July 2023 from an increment of 1.3 percent in June 2023. Also contributing to the downward trend of food inflation was sugar, confectionery and desserts with a slower annual increase of 24.3 percent during the month from 33.6 percent in the previous month.
In addition, lower annual increments were observed in the indices of the following food groups during the month:
a. Flour, bread and other bakery products, pasta products, and other cereals, 9.3 percent from 10.2 percent;
b. Milk, other dairy products and eggs, 9.6 percent from 11.1 percent;
c. Oils and fats, 1.3 percent from 4.5 percent;
d. Fruits and nuts, 5.1 percent from 7.8 percent; and
e. Ready-made food and other food products not elsewhere classified, 6.3 percent from 6.9 percent.
In contrast, compared with their previous month’s inflation rates, higher annual increments were noted in the indices of rice at 4.5 percent from 3.9 percent; corn at 5.0 percent from 4.6 percent; and vegetables, tubers, plantains, cooking bananas and pulses at 17.3 percent from 12.8 percent. (Tables 7 and 11)
2.2 Main Contributors to the Food Inflation
Food inflation contributed 60.2 percent share or 3.1 percentage points to the July 2023 overall inflation for this particular income group. Among the food groups, the main contributors to the food inflation during the month were the following:
a. Cereals and cereal products, which includes rice, corn, flour, bread and other bakery products, 40.9 percent share or 2.5 percentage points;
b. Vegetables, tubers, plantains, cooking bananas and pulses, 21.8 percent share or 1.3 percentage point; and
c. Fish and other seafood, 11.8 percent share or 0.7 percentage point.
B. National Capital Region (NCR)
The overall inflation in NCR for the bottom 30% income households retained its previous month’s annual growth rate of 6.6 percent in July 2023. In the same month of the previous year, inflation in the area was recorded at 5.3 percent. (Tables A, 5, 6, and 13)
Faster annual increments were observed in the indices of the following commodity groups during the month:
a. Food and non-alcoholic beverages, 6.6 percent from 6.2 percent;
b. Furnishings, household equipment and routine household maintenance, 5.7 percent from 5.4 percent;
c. Recreation, sport and culture, 3.4 percent from 3.1 percent;
d. Restaurants and accommodation services, 10.1 percent from 9.8 percent; and
e. Personal care, and miscellaneous goods and services, 4.3 percent from 4.2 percent.
On the other hand, compared with their previous month’s annual growth rates, slower annual mark-ups were registered in the indices of the following commodity groups during the period:
a. Alcoholic beverages and tobacco, 7.1 percent from 7.7 percent;
b. Clothing and footwear, 2.1 percent from 2.8 percent;
c. Housing, water, electricity, gas and other fuels, 6.9 percent from 7.0 percent; and
d. Transport, 4.7 percent from 7.8 percent.
Annual growth rate in the index for health still recorded an annual decrease of -0.7 percent during the month from -0.8 percent in the previous month.
The indices of the rest of the commodity groups remained at their respective previous month’s annual rates. (Tables 5 and 6)
C. Areas Outside NCR (AONCR)
Following the trend at the national level, inflation for the bottom 30% income households in AONCR also slowed down to 5.1 percent in July 2023 from its previous month’s annual rate of 6.0 percent. In July 2022, inflation for this group was registered at 7.2 percent. (Tables A, 5, and 14)
The deceleration of inflation for this income group was primarily influenced by the lower year-on-year increment in the heavily-weighted food and non-alcoholic beverages at 6.1 percent in July 2023 from 7.0 percent in June 2023. This was followed by housing, water, electricity, gas and other fuels with slower annual increase of 2.7 percent from 4.7 percent; and transport with a faster annual decline of -3.3 percent in July 2023 from -1.5 percent in the previous month.
Annual hikes were also slower in the indices of the following commodity groups during the month:
a. Alcoholic beverages and tobacco, 11.3 percent from 12.1 percent;
b. Clothing and footwear, 5.3 percent from 5.5 percent;
c. Furnishings, household equipment and routine household maintenance, 6.1 percent from 6.3 percent;
d. Health, 3.6 percent from 3.8 percent;
e. Restaurants and accommodation services, 7.3 percent from 7.7 percent; and
f. Personal care, and miscellaneous goods and services, 6.1 percent from 6.3 percent.
Meanwhile, faster annual increases were noted in the indices of recreation, sport and culture at 6.1 percent during the month from 5.9 percent in June 2023; and education services at 3.2 percent from 3.1 percent.
The indices of the rest of the commodity groups moved at their respective previous month’s annual growth rates. (Tables 5 and 6)
In July 2023, all regions outside NCR recorded lower inflation rates for the bottom 30% income households relative to their respective inflation rates in the previous month. Among regions outside NCR, the lowest inflation rate was observed in Region IX (Zamboanga Peninsula) at 3.2 percent. Meanwhile, the highest inflation rate was noted in MIMAROPA Region and Region VI (Western Visayas), both with 6.9 percent. (Table 6)
Note: CPIs and inflation rates for the bottom 30% income households by region are posted at the PSA OpenSTAT Portal at (http://openstat.psa.gov.ph/).
DENNIS S. MAPA, Ph.D.
Undersecretary
National Statistician and Civil Registrar General
See more at the Consumer Price Index for Bottom 30% Income Households main page.