Table A. Year-on-Year Inflation Rates
for the Bottom 30% Income Households, All Items
In Percent
(2018=100)
|
|
|
|
|
|---|---|---|---|---|
| Philippines | 7.3 | 5.2 | 5.6 | 7.4 |
| NCR | 5.6 | 6.6 | 7.2 | 8.0 |
| AONCR | 7.3 | 5.1 | 5.6 | 7.4 |
| Source: Philippine Statistics Authority, Retail Price Survey of Commodities for the Generation of Consumer Price Index *Year-on-year change of average CPI for January to August 2023 vs. 2022 | ||||

A. Philippines
1. Overall Inflation
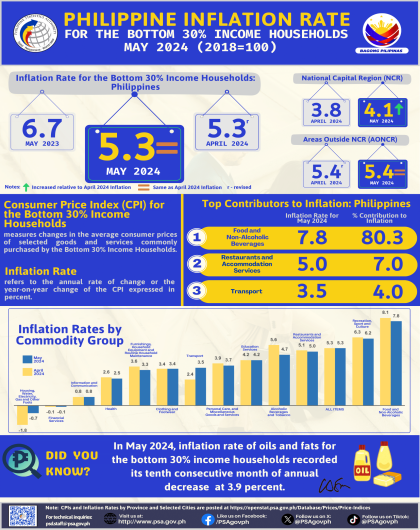
The country’s inflation rate for the bottom 30% income households increased to 5.6 percent in August 2023 from 5.2 percent in July 2023. The average inflation rate from January to August 2023 for this income group stood at 7.4 percent. In August 2022, inflation rate was posted at 7.3 percent. (Figure 1, and Tables A, B, 5, 6, and 12)
1.1 Main Drivers to the Downward Trend of the Overall Inflation
The main driver to the upward trend of the overall inflation for this income group in August 2023 was the higher year-on-year growth in the heavily-weighted food and non-alcoholic beverages at 7.7 percent from 6.1 percent in the previous month. This was followed by transport, which posted an annual increase of 1.1 percent during the month from -3.0 percent annual decline in July 2023.
In addition, higher annual increments were noted in the indices of the following commodity groups during the period:
a. Health, 3.5 percent from 3.4 percent;
b. Recreation, sport and culture, 6.7 percent from 6.0 percent; and
c. Education services, 3.7 percent from 3.3 percent.
In contrast, lower annual growth rates were noted in the indices of the following commodity groups during the month:
a. Alcoholic beverages and tobacco, 10.6 percent from 11.2 percent;
b. Furnishings, household equipment and routine household maintenance, 5.8 percent from 6.0 percent;
c. Information and communication, 0.7 percent from 0.8 percent;
d. Restaurants and accommodation services, 7.0 percent from 7.6 percent; and
e. Personal care, and miscellaneous goods and services, 5.9 percent from 6.0 percent.
Moreover, the index of housing, water, electricity, gas and other fuels recorded an annual drop of -0.7 percent in August 2023 from 3.0 percent in the previous month. The indices of the rest of the commodity groups retained their previous month’s annual rates. (Tables 5 and 6)
1.2 Main Contributor to the Overall Inflation
The following commodity groups were the top three contributors to the August 2023 overall inflation for the bottom 30% income households:
a. Food and non-alcoholic beverages, 74.7 percent share or 4.2 percentage points;
b. Restaurants and accommodation services, 9.2 percent share or 0.5 percentage point; and
c. Personal care, and miscellaneous goods and services, 5.0 percent share or 0.3 percentage point.
2. Food Inflation
Food inflation for the bottom 30% income households at the national level moved at a faster pace of 7.7 percent in August 2023 from 6.1 percent in July 2023. In the same month of the previous year, its annual rate was observed at 7.1 percent. (Table 9)
2.1 Main Drivers to the Downward Trend of the Food Inflation
The uptrend in the food inflation was mainly due to the higher annual increment in rice at 9.1 percent during the month from 4.5 percent in the previous month. This was followed by vegetables, tubers, plantains, cooking bananas and pulses with 23.6 percent inflation in August 2023 from 17.3 percent in July 2023. Fish and other seafood also contributed to the upward trend of the food inflation in August 2023 with 6.3 percent annual growth rate during the month from 4.4 percent in the previous month.
In addition, faster annual increment during the month was noted in the index of fruits and nuts at 6.6 percent from 5.1 percent in July 2023, while the index of meat and other parts of slaughtered land animals recorded a zero percent annual rate in August 2023 from an annual decline of -1.1 percent in the previous month.
In contrast, lower annual growths were observed in the indices the following food groups during the month:
a. Flour, bread and other bakery products, pasta products, and other cereals, 8.2 percent from 9.3 percent;
b. Milk, other dairy products and eggs, 7.6 percent from 9.6 percent;
c. Sugar, confectionery and desserts, 14.7 percent from 24.3 percent; and
d. Ready-made food and other food products not elsewhere classified, 6.0 percent from 6.3 percent.
Moreover, annual declines were noted during the month in the indices of corn at -0.2 percent from 5.0 percent annual growth rate in July 2023, and oils and fats at -0.9 percent from 1.3 percent in the previous month. (Tables 7 and 11)
2.2 Main Contributors to the Food Inflation
Food inflation contributed 70.7 percent share or 4.0 percentage points to the August 2023 overall inflation for this particular income group. Among the food groups, the main contributors to the food inflation during the month were the following:
a. Cereals and cereal products, which includes rice, corn, flour, bread and other bakery products, pasta products, and other cereals, with 46.6 percent share or 3.6 percentage points;
b. Vegetables, tubers, plantains, cooking bananas and pulses, with 23.3 percent share or 1.8 percentage points; and
c. Fish and other seafood, with 13.2 percent share or 1.0 percentage point.
B. National Capital Region (NCR)
Inflation for the bottom 30% income households in NCR, likewise, increased to 7.2 percent in August 2023 from 6.6 percent in July 2023. In the same month of the previous year, inflation in the area was recorded at 5.6 percent. (Tables A, 5, 6, and 13)
The uptrend of the inflation in the area was primarily brought about by the higher annual increment in the food and non-alcoholic beverages at 8.8 percent during the month from 6.6 percent in July 2023.
Faster annual increments were also observed in the indices of the following commodity groups during the month:
a. Clothing and footwear, 2.5 percent from 2.1 percent;
b. Furnishings, household equipment and routine household maintenance, 5.8 percent from 5.7 percent;
c. Transport, 5.6 percent from 4.7 percent; and
d. Recreation, sport and culture, 3.7 percent from 3.4 percent.
In addition, health index recoded a 1.4 percent annual increment during the month from -0.7 percent annual decline in July 2023.
On the other hand, slower annual mark-ups were registered in the indices of the following commodity groups during the period compared with their previous month’s annual growth rates:
a. Alcoholic beverages and tobacco, 6.4 percent from 7.1 percent;
b. Housing, water, electricity, gas and other fuels, 6.0 percent from 6.9 percent;
c. Education services, 3.5 percent from 7.5 percent;
d. Restaurants and accommodation services, 7.9 percent from 10.1 percent; and
e. Personal care, and miscellaneous goods and services, 4.2 percent from 4.3 percent.
The indices of the rest of the commodity groups remained at their respective previous month’s annual rates. (Tables 5 and 6)
C. Areas Outside NCR (AONCR)
Following the trend at the national level and NCR, inflation for the bottom 30% income households in AONCR also showed an uptrend in August 2023 at 5.6 percent from 5.1 percent in the previous month. In August 2022, inflation for this income group was registered at 7.3 percent. (Tables A, 5, and 14)
The acceleration of inflation for this income group was primarily influenced by the higher year-on-year increment in the heavily-weighted food and non-alcoholic beverages at 7.7 percent in August 2023 from 6.1 percent in July 2023. This was followed by transport, which posted an annual increase of 1.0 percent during the month from an annual decline of -3.3 percent in July 2023. Also, recreation, sport and culture, and education services recorded faster annual increases of 6.8 percent and 3.7 percent, respectively, in August 2023 from their corresponding previous month’s annual growth rates of 6.1 percent and 3.2 percent. In contrast, the indices of the following commodity groups recorded lower annual growth rates during the month:
a. Alcoholic beverages and tobacco, 10.8 percent from 11.3 percent;
b. Furnishings, household equipment and routine household maintenance, 5.8 percent from 6.1 percent;
c. Information and communication, 0.7 percent from 0.8 percent;
d. Restaurants and accommodation services, 6.9 percent from 7.3 percent; and
e. Personal care, and miscellaneous goods and services, 5.9 percent from 6.1 percent.
The housing, water, electricity, gas and other fuels index had an annual decline of -1.1 percent in August 2023 from an annual increment of 2.7 percent in the previous month. The indices of the rest of the commodity groups retained their respective previous month’s annual rates. (Tables 5 and 6)
In August 2023, 12 regions outside NCR recorded higher inflation rates for the bottom 30% income households relative to their respective inflation rates in the previous month. The highest inflation rate was recorded in Region III (Central Luzon) at 8.1 percent. Meanwhile, the lowest inflation rate was observed in Region XI (Davao Region) at 3.0 percent. (Table 6)
Note: CPIs and inflation rates for the bottom 30% income households by region are posted at the PSA OpenSTAT portal at (http://openstat.psa.gov.ph/).
CLAIRE DENNIS S. MAPA, PhD.
Undersecretary
National Statistician and Civil Registrar General
See more at the Consumer Price Index for Bottom 30% Income Households main page.