1. INTRODUCTION
The Consumer Price Index (CPI) measures the changes in the price level of goods and services that most people buy for their day-to-day consumption. The change in the price level of these goods and services over a specific period of time, usually a year is the rate of inflation. Inflation is equivalent to a decline in the internal purchasing power of peso.
Since families in the low-income bracket are most vulnerable to economic and social difficulties, monitoring the welfare of these families is one of the main thrusts of the government. Based on the “relative poverty” concept, a household whose per capita income falls below the bottom 30% of the cumulative per capita distribution belongs to the low-income group. One of the common characteristics of households in this income group is that expenditures on food items account for a more substantial proportion of expenditures compared to expenditures on other items. Price changes of food therefore, would be expected to greatly affect this income group than any other group. Hence, it was proposed that a CPI be constructed also for the low-income group with 2000 as the base year. The National Statistical Coordination Board (NSCB) approved the methodology for the computation of the CPI for the bottom 30% income group households (NSCB Resolution No.5, Series of 2009 “Approving the Estimation Methodology for the Consumer Price Index for the Bottom 30 Percent Income Group Households.”
A separate CPI for the bottom 30% income households can provide a more appropriate deflator of income and inflator of food prices and other basic commodities, which can be used by the government in their plans and programs to improve the standard of living of low-income families. Moreover, this index would measure the composite change over time of the retail prices of goods and services commonly purchased by households in this income category.
For the purpose of generating a separate CPI series for the bottom 30% income households, different sets of market baskets and weights from that of the CPI for all income households were constructed based on the results of the updating activity of the 1994 market basket and the 2000 Family Income and Expenditure Survey (FIES).
2. DEFINITION OF TERMS AND CONCEPT USED
2.1 Index Number
A device used to compare relative movement in the magnitude of a variable or group of distinct but related variables between two or more points in time. An index number also shows the relative differences in the magnitude of a variable obtained at the same period of time in different areas. It is expressed in percentage form and its unit of measure is percentage point.
2.2 Consumer Price Index (CPI)
A single number used to measure changes in the average retail prices of a market basket or collection of goods and services commonly purchased by an average Filipino household. It shows how much on the average, prices of goods and services have increased or decreased from a particular reference period known as base year.
2.3 Market Basket
A term used to refer to a sample of goods and services that is used to represent all goods and services bought.
2.4 Weight
For the CPI, the weighting pattern uses expenditures on various items by households as a proportion to total expenditure. Weight is a value attached to a commodity or group of commodities to indicate the relative importance of that commodity or group of commodities in the market basket.
The total (all items) national expenditure is equal to100. The weight of the region is equal to the sum of the weights of the provinces belonging to that region. The sum of the weights of the region equals the national weight.
2.5 Base Period
A period, usually a year, at which the index number is set to 100. It is the reference point of the index number series.
3. COMPARISON OF THE COMPONENTS OF THE ALL INCOME CPI AND CPI FOR BOTTOM 30%
3.1 Weights by Major Commodity Group and by Area
The weights used for the 2000-based CPI were derived from the expenditure data based from the results of the 2000 FIES, a nationwide survey that covered 39,615 households. The survey gathered income and expenditure data, which include the levels of consumption by item of expenditure up to the level necessary for the generation of the CPI weights. The estimated weights based from the results of the 2000 FIES for all income and bottom 30% income households by major commodity group and by area are summarized in Table 1 below.
Table 1 reveals that there are differences in the weights between the all income and bottom 30% income households for the six major commodity groups: Food, Beverages and Tobacco (FBT), Clothing, Housing and Repairs (H&R), Fuel, Light and Water (FLW), Services and Miscellaneous items in the three major areas: Philippines, National Capital Region (NCR) and Areas Outside the National Capital Region (AONCR). This implies that there are differences in the expenditure patterns between the two income groups.
Table 1. Weights for All Income and Bottom 30% Income Households by Major Commodity Group and by Area
| Major Commodity Group | Area | |||||
|---|---|---|---|---|---|---|
| Philippines | National Capital Region (NCR) | Areas Outside NCR (AONCR) | ||||
| All Income | Bottom 30% | All Income | Bottom 30% | All Income | Bottom 30% | |
| All Items | 100.0 | 100.0 | 100.0 | 100.0 | 100.0 | 100.0 |
| FBT | 50.0 | 74.5 | 40.2 | 74.9 | 54.2 | 74.5 |
| Clothing | 3.0 | 2.7 | 2.6 | 1.6 | 3.2 | 2.7 |
| H&R | 16.8 | 3.0 | 24.6 | 1.3 | 13.4 | 3.1 |
| FLW | 6.9 | 7.0 | 7.0 | 8.5 | 6.9 | 7.0 |
| Services | 15.9 | 7.1 | 19.3 | 7.4 | 14.4 | 7.1 |
| Miscellaneous | 7.3 | 5.7 | 6.2 | 6.3 | 7.8 | 5.7 |
3.1.1 Philippines
Based from the table above, FBT had the largest weight among the six major commodity groups in both income households in the Philippines. The bottom 30% income households had a much larger FBT weight of 74.5 percent than the all income households with an estimated weight of 50.0 percent. This clearly shows that low-income households in the country spent a big share of their income on FBT items. Similarly, the estimated weights for fuel, light and water (FLW) which is 7.0 percent for the bottom 30% income households is slightly higher than the 6.9 percent share for the all income households.
The estimated weights for services, miscellaneous items, housing and repairs (H&R) and clothing among the low-income families were lower compared to their corresponding all income group weights.
3.1.2 National Capital Region (NCR)
Table 1 also shows that FBT accounted the biggest weight among the six commodity groups in both income households in NCR. Thus, families in the bottom 30% income ladder has a bigger expenditure share on FBT items (74.9%) compared to those belonging to the all income group (40.2%) in the area. On the other hand, all other commodity groups have lower weights in the bottom 30% income households compared to the all income households except for FLW and miscellaneous group. It is interesting to note that both income households in NCR spent almost the same share of their income on miscellaneous items as seen in their estimated weights of 6.3 percent for the bottom 30% income group and 6.2 percent for the all income households.
3.1.3 Areas Outside the National Capital Region (AONCR)
The same observations were noted in AONCR. It is also seen in Table 1 that FBT commodity group, which weighed 54.2 percent in the all income households had a bigger weight in the bottom 30% income households at 74.5 percent. Similarly, the weight for FLW group in the bottom 30% income households is slightly higher than its weight in the all income households. This resulted as all the regions in this area registered higher expenditure on fuel. On the other hand, the clothing, housing and repairs (H & R), services and miscellaneous groups posted lower weights in the bottom 30% income households compared to the all income households.
Weights across regions likewise varied between all income and bottom 30% income households. The estimated regional weights for all commodity groups for both income households are displayed in Appendix 2.
In the bottom 30% income households, Region 6 had the highest weight of 11.8 percent and CAR had the lowest weight of 1.8 percent in AONCR. On the other hand, Region 4A (CALABARZON) accounts the biggest weight in the all income category of 14.6 percent while Caraga posted the lowest weight of 1.6 percent.
Except for Regions 3 and 4A (CALABARZON), all other regions registered bigger weights in the bottom 30% income group than in the all income group.
3.2 Market Basket by Major Commodity Group and by Area
The market basket used in the construction for the 2000-based bottom 30% CPI series is the result of the updating of the 1994 market basket. The bottom 30% market basket is a subset of the 2000-based all income market basket. Please refer to Appendix 3 for the percentage composition of items in the bottom 30% income group basket to that of the all income group.
Of the 716 items in all income market basket in NCR, 476 or 66.5 percent belonged to the bottom 30% income market basket. In AONCR, this number ranged from 53.3 percent (Eastern Samar) to 96.9 percent (Mt. Province).
IV. RESULTS
4.1 Comparison of Inflation Rates for All Income and Bottom 30% Income Households by Major Commodity Group and by Area (January 2010 - December 2010)
4.1. ALL ITEMS
Figure 1. Inflation Rates for All Items in the Philippines by Income Households (2000=100)
Figure 2. Inflation Rates for All Items in NCR by Income Households (2000=100)
Figure 3. Inflation Rates for All Items in AONCR by Income Households (2000=100)
ALL ITEMS
The figures above present the inflation rates for All Items in the Philippines (Figure 1), NCR (Figure 2) and AONCR (Figure 3) by income households for the period January 2010 to December 2010. The line graphs show that the inflation rates in the all income and bottom 30% income households generally moved in similar directions in the three areas. The figures also show that the inflation rates for the bottom 30% income households were generally lower than those of the all income households. This finding is seen in the posted annual average inflation rate for bottom 30% percent income households, which is consistently lower in the three areas compared with the annual average inflation for all income households. The annual average inflation was 3.6 percent (Philippines), 3.3 percent (NCR) and 3.6 percent (AONCR) for the bottom 30% income households and 3.8 percent (Philippines), 4.0 percent (NCR) and 3.7 percent (AONCR) for the all income households.
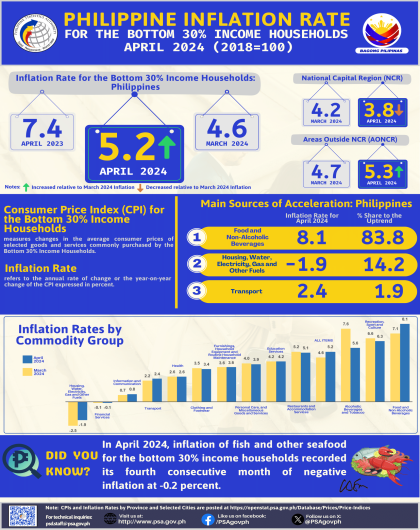
Highest inflation rate for the bottom 30% income households in the Philippines was noted in January at 4.8 percent while highest inflation rate in the all income households was noted in the months of March and April at 4.4 percent. On the other hand, lowest inflation rate was posted at 2.9 percent in December for the bottom 30% income households and 2.8 percent in October for the all income households.
The inflation rates for the bottom 30% income households in NCR were generally lower during the year in review compared to the all income households except for the months of January and February. In NCR, the inflation rate for both income groups picked up in April at 4.6 percent for bottom 30% income households and 5.3 percent for the all income households. On the other hand, both income groups had lowest inflation rate in October at 0.4 percent for the bottom 30% income households and 2.2 percent for the all income households.
The highest inflation rate for both income households in AONCR was also noted in the month of January while the lowest inflation was observed in December for the bottom 30% income households and in November and December for the all income households.
4.2. Food, Beverages and Tobacco (FBT)

Figure 4. Inflation Rates for FBT in the Philippines by Income Households (2000=100)
Figure 5. Inflation Rates for FBT in NCR by Income Households (2000=100)

Figure 6. Inflation Rates for FBT in AONCR by Income Households (2000=100)
Food, Beverages and Tobacco (FBT)
Inflation rates for FBT for all income and bottom 30% income households for the whole country both followed a fluctuating trend from January to December 2010 as shown in the figures above.
Generally, the whole country’s inflation rates for the bottom 30% income households stood at higher levels than that of the all income households during the period in review. The higher inflation rates registered by FBT together with the bigger weights attached to this commodity group in the bottom 30% income households triggered higher inflation rates in the series than in the all income households in the Philippines. Specifically, the differences in the inflation rates for the two income groups were due to the price increases in sugar during the period in review in all areas. Moreover, bigger weight was also assigned to miscellaneous group in the bottom 30% income households than the all income households. The annual average inflation rate of 3.5 percent for the bottom 30% income households in the Philippines was higher by 0.5 percentage point compared to the 3.0 percent posted annual average inflation rate for the all income households. Similarly, the annual average inflation rate for the bottom 30% income households was higher by only 0.1 percentage point than that of the all income households in NCR and AONCR.
The inflation rate for FBT for both income households in the Philippines was posted as highest in January at 5.0 percent for the bottom 30% income households and 4.3 percent for the all income household. On the other hand, lowest inflation was registered at 2.7 percent in December for the bottom 30% income households and 1.9 percent in November for the all income households.
In NCR, highest inflation for FBT was also observed in January for both income households at 3.3 percent for the bottom 30% income households and 3.5 percent for the all income households. On the other hand, negative movement in FBT was noted in the month of October for both income households at -1.0 percent as the prices of fruits and vegetables including meat went down during the month in NCR.
In AONCR, inflation for FBT was also highest in January at 5.0 percent for the bottom 30 percent income households and 4.5 percent for the all income households. The inflation was lowest in December at 2.8 percent for the bottom 30 % income households and in November at 2.3 percent for the all income households.
4.1.3 Clothing
Figure 7. Inflation Rates for Clothing in the Philippines by Income Households (2000=100)
Figure 8. Inflation Rates for Clothing in NCR by Income Households (2000=100)
Figure 9. Inflation Rates for Clothing in AONCR by Income Households (2000=100)
Clothing
Inflation rates for clothing items for bottom 30% income households in the Philippines were generally higher compared with the rates in the all income households. Increases in the sewing charges in NCR and the rise in the prices of footwear items in AONCR contributed to higher inflation rates in the bottom 30% income households than in the all income households in the Philippines.
The inflation rates for the bottom 30% income group for Philippines were higher than the all income group during the year in review except in the month of December when the rate for the bottom 30% income households was lower by 0.1 percentage point than the all income households. Likewise, in October when indexes of both income households moved at the same rate of 1.9 percent.
In NCR, higher inflation were observed for the bottom 30% income households than the all income household except in the month of February when inflation rate was lower by only 0.1 percentage point. Indexes in both income households moved at the same rate in January, March and December at 1.5 percent, 1.6 percent and 1.3 percent respectively.
Inflation rates for clothing in AONCR for the bottom 30 % income households were lower than the rates in the all income households except in January when its rate was slightly higher by only 0.1 percentage point than the all income households. Indexes in both income households posted the same rate for clothing items in the months of February and from June to October during the year in review.
4.1.4 Housing and Repairs (H & R)

Figure 10. Inflation Rates for H & R in the Philippines by Income Households (2000=100)
Figure 11. Inflation Rates for H & R in NCR by Income Households (2000=100)
Figure 12. Inflation Rates for H & R in AONCR by Income Households (2000=100)
Housing and Repairs (H & R)
The inflation rates for H & R in the bottom 30% income households were lower than the all income households in the Philippines. This can be attributed to the increases in the prices of selected construction materials and rental rates that were emphasized in the all income households because of much bigger weights assigned to minor repairs and rentals commodity groups compared to the weights in the bottom 30% income households. The national rate for the bottom 30% income households was largely influenced by the behavior of AONCR rates. The inflation rates for the bottom 30% income households moved from 1.5 percent to 1.7 percent during the year in review. Similarly, the inflation rates for the all income households also ranged from 1.5 percent to 2.0 percent.
The average inflation rates for both income households in NCR moved at almost the same rate at 1.6 percent. The inflation rates for both income households was highest in November and December at 2.4 percent for the bottom 30% income households and 2.3 percent for the all income households. On the other hand, indexes in both income households had a lowest inflation rate of 1.1 percent in February.
The inflation rates for H & R in the bottom 30% income households were lower than the all income households in AONCR. The highest inflation rate for bottom 30% income households was noted in May at 1.8 percent and in January at 2.4 percent for the all income households. Both income households moved at the same rate of 1.6 percent in September and October.
4.1.5 Fuel. Light and Water (FLW)

Figure 13. Inflation Rates for FLW in the Philippines by Income Households (2000=100)
Figure 14. Inflation Rates for FLW in NCR by Income Households (2000=100)
Figure 15. Inflation Rates for FLW in AONCR by Income Households (2000=100)
Fuel, Light and Water (FLW)
FLW group registered the highest annual average inflation rate (double-digit) among the major commodity groups in both the indexes for all income households and bottom 30% income households. Inflation rates for FLW posted in the three areas were generally lower in the bottom 30% income households than in the all income households as seen in the line graphs above.
In the all income households, light has the biggest weight among the commodity groups under FLW thus upward price adjustments in the electricity rates during the period had a big influence in the FLW group. The bottom 30% income households index do not include in its market basket the 1000-kilo-watt-hour electricity consumption where charges in energy tax are part of the electric bill hence, increases in the electricity rate for this item were not accounted for in this income category.
In the all income households, fuel has the second biggest weight among the commodity groups under FLW and hence increases in the prices of LPG and kerosene during the period also contributed to the higher inflation posted in the FLW group. In the bottom 30% income households, fuel posted the biggest weight compared to light and water groups thus increases in the prices of fuel items during the period in review also contributed to the higher inflation rates for the FLW group. Since light posted higher inflation rates compared to fuel and that bigger weights were also attached to this group in the all income households then the inflation rates for the FLW group in the all income households were higher compared to the bottom 30% income households.
Inflation rates for FLW for the bottom 30% income households in the Philippines picked up to 12.6 percent in May while that of the all income households was 18.0 percent in April.
4.1.6 Services
Figure 16. Inflation Rates for Services in the Philippines by Income Households (2000=100)
Figure 17. Inflation Rates for Services in NCR by Income Households (2000=100)

Figure 18. Inflation Rates for Services in AONCR by Income Households (2000=100)
Services
Generally, average inflation rates for services in the three areas were consistently lower in the bottom 30% income households than those in the all income households. This is mainly due to the much lower weights assigned in all of the subgroups in the bottom 30% income households than in the all income households.
Increments in the prices of items in the services allied to transport, especially oil, gasoline and diesel which had the biggest weight under services allied to transport group in the all income households contributed to the higher inflation rates in the Services group compared to the bottom 30% income households.
Higher inflation rates observed in the all income households compared to the bottom 30% income households were also due to the increases in the tuition fees in college, high school, grade school and pre-school in private schools and add-ons in the prices of school supplies. The increases effected higher inflation rates for Services group in the all income households due to bigger weights assigned to this group.
Increases in the prices of other items in personal, medical and recreational services subgroups along with the bigger weights attached to these subgroups in the all income households compared to the bottom 30% income households resulted to higher inflation rate in the all income households.
The monthly inflation rates for the bottom 30% income households in the three areas were consistently lower than the all income households during the year in review.
4.1.7 Miscellaneous Items

Figure 19. Inflation Rates for Miscellaneous Items in the Philippines by Income Households (2000=100)

Figure 20. Inflation Rates for Miscellaneous Items in NCR by Income Households (2000=100)
Figure 21. Inflation Rates for Miscellaneous Items in AONCR by Income Households (2000=100)
Miscellaneous Items
In the Philippines, NCR and AONCR, inflation rates for miscellaneous items in both income households followed the same trend for most of the period. The monthly inflation rates for the bottom 30% income households were consistently higher than the all income households for all months in 2010 in the three areas. The annual average inflation rates for the bottom 30% income households were consistently higher by 0.5 percentage point in the three major areas.
The add-ons in the prices of laundry and cleaning supplies and other household operations items together with the bigger weights attached to household operations group in the bottom 30% income households than in the all income households triggered higher inflation rates in the miscellaneous group in the Philippines.
In AONCR, increases in the prices of household furnishing and equipment, which have lower weights in the bottom 30% income households were offset by the higher prices of household operations items and personal care and effects which have bigger weights in this income category.
Source: National Statistics Office
Manila, Philippines