
Highlights of the Philippine Export and Import Statistics April 2024 (Preliminary)
MERCHANDISE EXPORT PERFORMANCE
JUNE 2006
( Preliminary )*
* Includes transactions that passed through Automated Export Documentation System (AEDS).
p - preliminary
r - revised
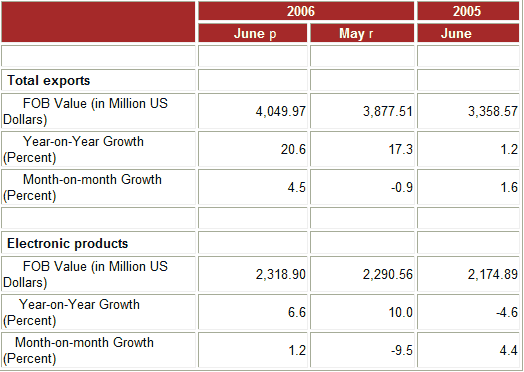
Merchandise exports up by 20.6 percent
c
Electronic products register 6.6 percent increment
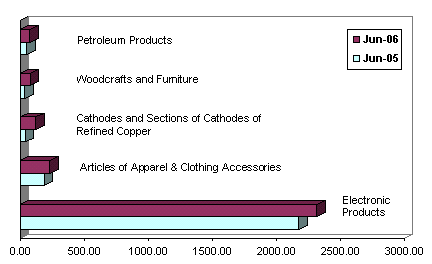
Electronic products, accounting for 57.3 percent of the aggregate export revenue in June, recorded an increase of 6.6 percent to $2.319 billion from $2.175 billion a year earlier.
Among the major groups of electronic products, components/devices (Semiconductors) got the major share with 43.4 percent to total exports. Semiconductors posted a positive growth at 9.1 percent to $1.756 billion from $1.610 billion during the same month in 2005. The other electronic products group that showed inceases were Electronic Data Processing at 1.1 percent with a share of 10.7 percent, Office Equipment at 23.3 percent with a share of 0.51 percent, Telecommunication at 216.9 percent with a share of 0.47 percent, and Medical/Industrial Instrumentation at 11.9 percent with a share of 0.04 percent to total exports.
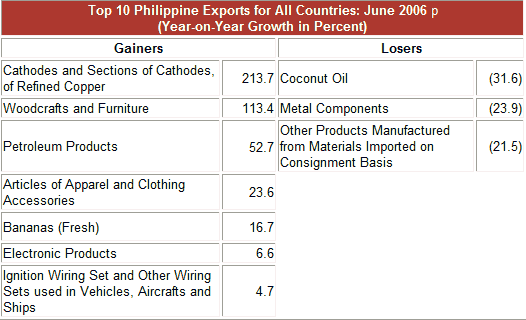
Articles of apparel and clothing accessories remained as the country’s second top earner with a combined share of 5.7 percent and an aggregate receipt of $232.13 million or 23.6 percent higher than $187.76 million a year ago. This was brought about by the bulk order of women's wear, as well as trousers, breeches and short.
Cathodes and sections of cathodes, of refined copper, ranked third with total revenue of $120.73 million reflecting a 213.7 percent climb from $38.49 million during the same period of 2005.
Woodcrafts and furniture, ranked fourth with sales amounting to $76.56 million or a year-on-year increase of 113.4 percent from $35.87 million, resulting from higher demand in other builders' joinery and carpentry of wood and other wooden furniture parts.
Revenue from petroleum products with a 1.9 percent share, registered a $76.51 million worth of exports from $50.12 million a year ago. The growth in petroleum products can be attributed to the higher demand in fuel oils and lubricating greases.
Rounding up the list of the top exports for the month of June 2006 were ignition wiring set and other wiring sets used in vehicles, aircrafts and ships (consists only of electrical wiring harness for motor vehicles), $54.45 million or a year-on-year increase of 4.7 percent; other products manufactured from materials imported on consignment basis, with sales amounting to $53.62 million or an annual decline of 21.5 percent from $68.28 million; bananas (fresh), with revenue recorded at $35.93 million or a year-on-year positive rate of 16.7 percent; coconut oil with proceeds billed at $30.28 million and exportations of metal components, valued at $26.88 million.
Total receipts from the top ten exports reached $3.026 billion, or 74.7 percent of the total exports.
Fig. 1 Philippine Top Exports: June 2006 and 2005
(F.O.B. Value in Million US Dollars)
Exports of manufactured goods went up by 10.9 percent
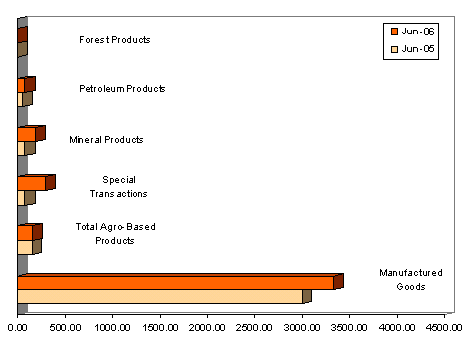
Accounting for 82.1 percent of the total receipts, exports of manufactured goods was $3.327 billion with a 10.9 percent growth from $3.001 billion during the same period of 2005.
Earnings from all agro-based products combined for $157.02 million or 3.9 percent of the total export revenue. Compared to last year, aggregate receipt for this commodity group gained 2.6 percent from $153.08 million.
Income from special transactions rose by as much as 290.8 percent to $297.62 million from $76.16 million while receipts from exports of mineral products improved by 147.1 percent to $188.46 million from $76.28 million.
Petroleum products registered earnings of $76.51 million, while forest products contributed $3.53 million.
Fig. 2 Philippine Exports by Commodity Group: June 2006 and 2005
(F.O.B. Value in Million US Dollars)
Exports to Japan account for 20.3 percent
Exports to Japan valued at $822.20 million, accounted for 20.3 percent of the country's aggregate income for the month. Receipts grew by 58.9 percent from last year's reported figure of $517.32 million.
United States followed with a 17.2 percent share. With earnings of $696.69 million, exports to United States picked up by 22.1 percent from $570.50 million.
People's Republic of China emerged as the third biggest market for the month as shipments of local goods amounted to $399.28 million or 9.9 percent of the total. Exports gained by 7.1 percent from $372.70 million compared to the same period of 2005.
Hong Kong accounted for 8.2 percent of the total revenue, with $329.99 million reflecting a 9.2 percent increment from $302.15 million during the same month a year ago.
Other top markets for June 2006 were Singapore, $306.06 million; Netherlands, $265.49 million; Malaysia, $223.50 million; Taiwan, $186.96 million; Germany, $139.33 million; and Thailand, $136.67 million.
Total export receipts from RP's top ten markets for the month of June amounted to $3.506 billion or 86.6 percent of the total.
Fig. 3 Philippine Top Exports by Country: June 2006
(F.O.B. Value in Million US Dollars)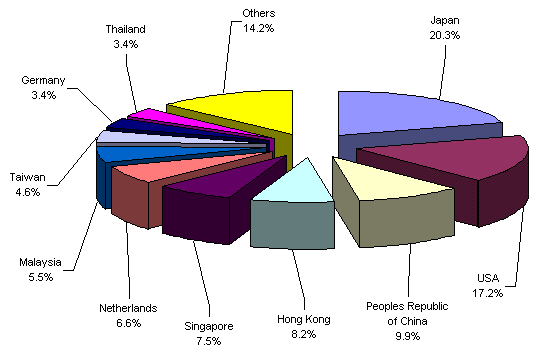
(Sgd.) CARMELITA N. ERICTA
Administrator
Source: Economic Indices and Indicators Division
Industry and Trade Statistics Department
National Statistics Office
Manila, Philippines
