
Highlights of the Philippine Export and Import Statistics April 2024 (Preliminary)
HIGHLIGHTS OF THE PHILIPPINE EXPORT AND IMPORT STATISTICS
NOVEMBER 2019 (Preliminary)
Table A.1 Summary of External Trade Performance: November 2019 and November 2018
| Exports | Imports | |||
| November 2019p | November 2018r | November 2019p | November 2018r | |
| TOTAL | ||||
| FOB Value (in Million US Dollars) | 5,596.48 | 5,636.46 | 8,938.34 | 9,710.64 |
| Year-on-Year Growth (Percent) | -0.7 | 1.0 | -8.0 | 9.6 |
| Electronic Products | ||||
| FOB Value (in Million US Dollars) | 3,281.06 | 3,235.39 | 2,436.67 | 2,586.61 |
| Year-on-Year Growth (Percent) | 1.4 | 0.9 | -5.8 | 5.0 |
| p – preliminary, r – revised | ||||
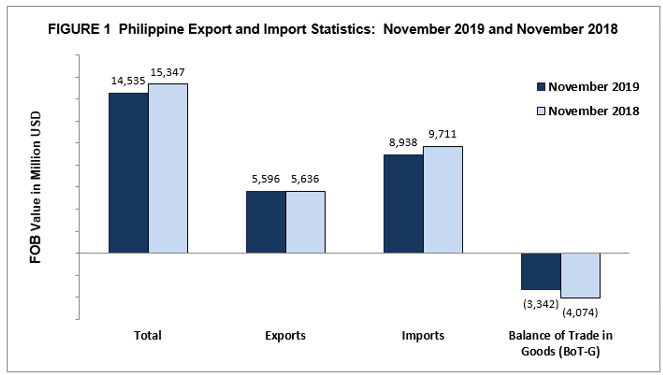
1. Total external trade declines by 5.3 percent
The country’s total external trade in goods in November 2019 amounted to USD14.54 billion which represents a decrease of 5.3 percent from the USD15.35 billion external trade in the same month of the previous year. Of the total external trade, USD5.60 billion (38.5%) were exported goods and USD8.94 billion (61.5 %) were imported goods. (Figure 1)
The country’s balance of trade in goods (BoT-G) in November 2019 recorded a USD3.34 billion deficit which was lower by 18.0 percent from the USD4.07 billion deficit in November 2018. (Figure 1, Table 1)
2. Exports decrease by 0.7 percent
The country’s total export sales in November 2019 was USD5.60 billion, a decrease by 0.7 percent from the USD5.64 billion total export sales in November 2018. This was due to the double-digit decrements in the export sales of three of the top 10 major export commodities, namely, ignition wiring set and other wiring sets used in vehicles, aircrafts and ships (-23.7%); machinery and transport equipment (-21.7%); and electronic equipment and parts (-20.5%). (Table A.2)
Table A.2 Top 10 Philippine Exports to All Countries: November 2019
Year-on-Year Growth in Percent
| Gainers | Losers | ||
| Other Mineral Products | 74.9 | Ignition Wiring Set and Other Wiring Sets Used in Vehicles, Aircrafts and Ships | -23.7 |
| Other Manufactured Goods | 41.5 | Machinery and Transport Equipment | -21.7 |
| Cathodes and Section of Cathodes, of Refined Copper | 36.0 | Electronic Equipment and Parts | -20.5 |
| Bananas (Fresh) | 11.1 | ||
| Metal Components | 3.0 | ||
| Electronic Products | 1.4 | ||
| Chemicals | 0.1 | ||
| p – preliminary, r- revised | |||
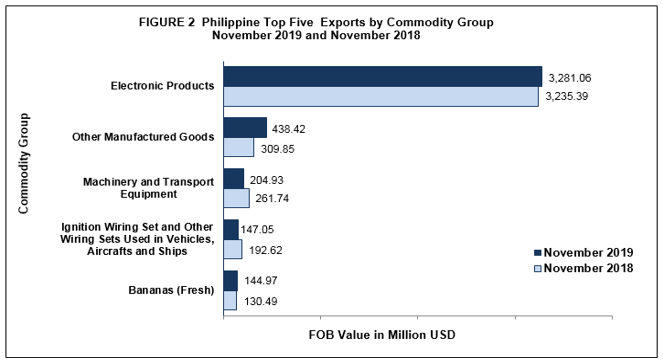
3. Exports of electronic products account for 58.6 percent of the total exports
By commodity group, exports of electronic products continued to be the country’s top export with total earnings of USD3.28 billion. This amount, which accounted for 58.6 percent of the total exports in November 2019, went up by 1.4 percent from the USD3.24 billion export receipt in November 2018. (Figure 2)
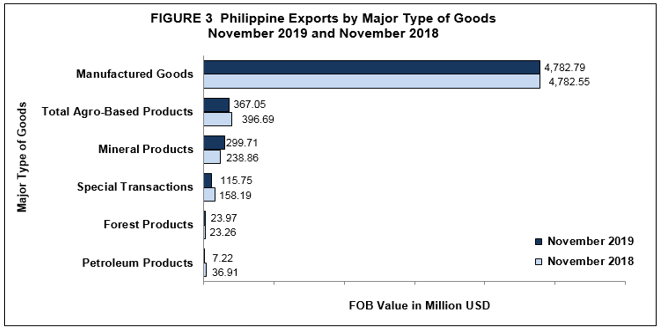
4. Exports of manufactured goods increase by 0.005 percent
By major type of goods, exports of manufactured goods accounted for 85.5 percent of the total exports or a value of USD4.78 billion in November 2019. It went up by 0.005 percent from USD4.78 billion export value registered in November 2018. (Figure 3)
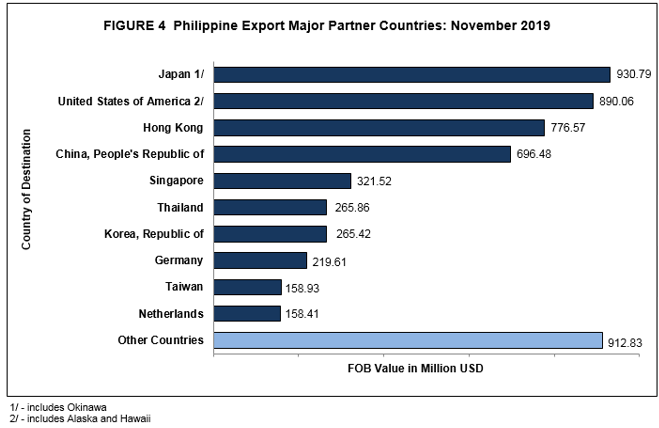
5. Among the Philippine’s major trading partners, Japan accounts for the highest export value
By major trading partner, exports to Japan comprised the highest value of USD930.79 million or a share of 16.6 percent to the total exports in November 2019. Exports to this country grew by 4.9 percent, from USD887.32 million in November 2018. Other major export trading partners were the United States of America (USA) with export value of USD890.06 million; Hong Kong, USD776.57 million; People’s Republic of China, USD696.48 million; and Singapore, USD321.52 million. (Figure 4)
6. Exports to countries in East Asia account for 50.6 percent
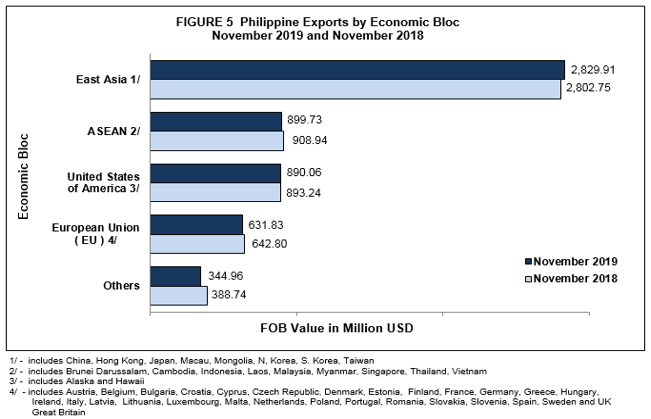
By economic bloc, 50.6 percent of the country’s merchandise exports in November 2019 or USD2.83 billion went to countries in East Asia. This amount went up by 1.0 percent, from USD2.80 billion in November 2018. (Figure 5)
7. Imports decrease by 8.0 percent
Total imported goods in November 2019 contracted by 8.0 percent, from USD9.71 billion in November 2018 to USD8.94 billion in November 2019. The decrease was due to the decrements of eight of the top 10 major import commodities. These were mineral fuels, lubricants and related materials (-34.9%); cereals and cereal preparations (-31.1%); iron and steel (-29.8%); electronic products (-5.8%); other food and live animals (-3.7%); plastics in primary and non-primary forms (-3.4%); industrial machinery and equipment (-3.2%); and transport equipment (-0.1%). (Table A.3)
Table A.3 Top 10 Philippine Imports from All Countries: November 2019
Year-on-Year Growth in Percent
| Gainer | Losers | ||
| Telecommunication Equipment and Electrical Machinery | 24.8 | Mineral Fuels, Lubricants and Related Materials | -34.9 |
| Miscellaneous Manufactured Articles | 7.8 | Cereals and Cereal Preparations | -31.1 |
| Iron and Steel | -29.8 | ||
| Electronic Products | -5.8 | ||
| Other Food and Live Animals | -3.7 | ||
| Plastics in Primary and Non-Primary Forms | -3.4 | ||
| Industrial Machinery and Equipment | -3.2 | ||
| Transport Equipment | -0.1 | ||
| p – preliminary | |||
8. Imports of electronic products share 27.3 percent to the total imports
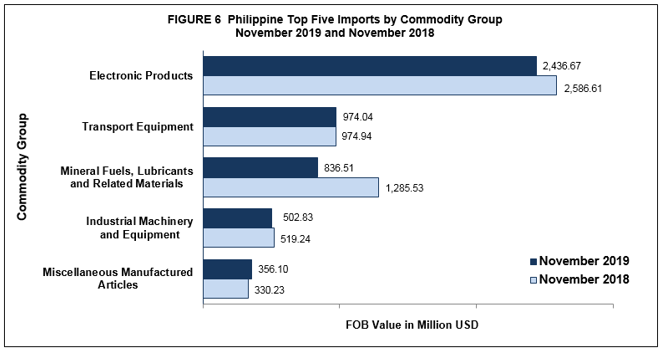
Among the imported commodity groups, import bills of electronic products, valued at USD2.44 billion, contributed the highest share of 27.3 percent to the total imports. Import of this commodity group declined by 5.8 percent, from USD2.59 billion in November 2018. (Figure 6)
9. Imports of raw materials and intermediate goods down by 14.6 percent
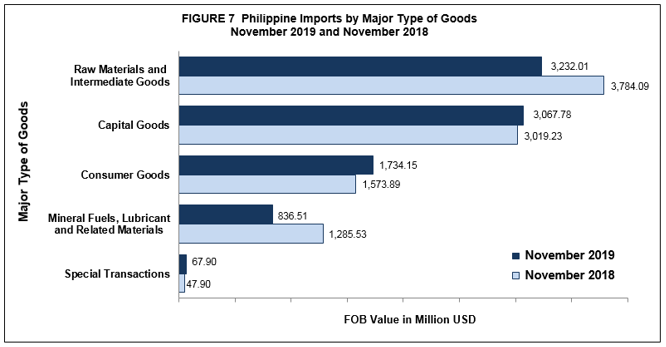
By major type of goods, imports of raw materials and intermediate goods contributed the largest share of 36.2 percent to the total import value. It decreased by 14.6 percent, from USD3.78 billion in November 2018 to USD3.23 billion in November 2019. Imports of capital goods, which shared 34.3 percent or an import value of USD3.07 billion, ranked second. Consumer goods placed third with a share of 19.4 percent or an import value worth USD1.73 billion. (Figure 7)
10. People’s Republic of China has the highest import value
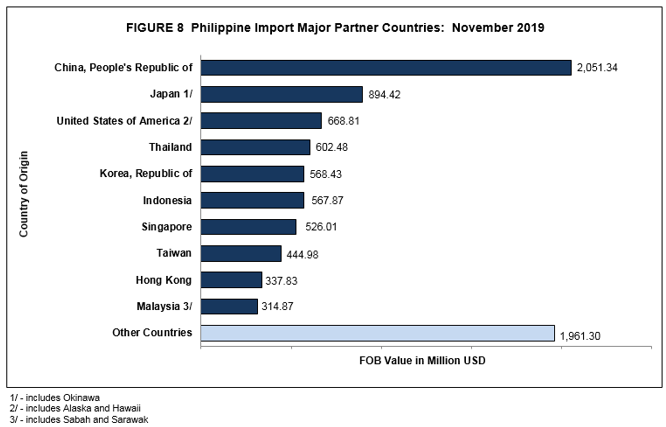
The People’s Republic of China was the country’s biggest supplier of imported goods with 22.9 percent share to the total imports in November 2019. Import payments from this country amounted to USD2.05 billion, from USD1.80 billion in November 2018. Other major import trading partners were Japan with import value of USD894.42 million; USA, USD668.81 million; Thailand, USD602.48 million; and Republic of Korea, USD568.43. (Figure 8)
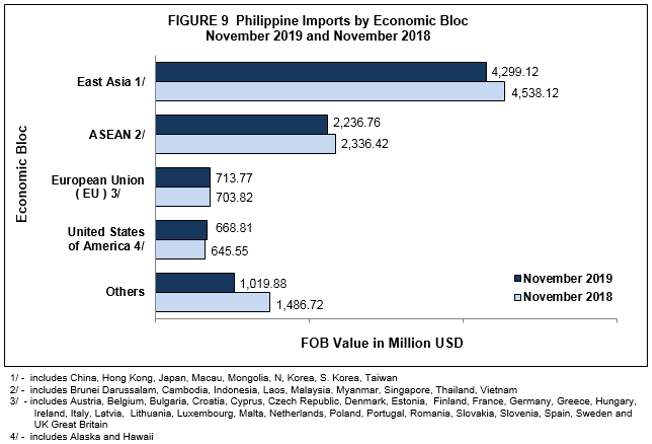
11. Imports from countries in East Asia comprise 48.1 percent
By economic bloc, East Asia was the biggest supplier of the country’s imports in November 2019 with a value of USD4.30 billion or 48.1 percent of the total imports. This amount decreased by 5.3 percent, from USD4.54 billion in November 2018. (Figure 9)
(Sgd.) CLAIRE DENNIS S. MAPA, Ph.D.
Undersecretary
National Statistician and Civil Registrar General
Explanatory Notes
Export and import trade statistics are compiled by the Philippine Statistics Authority (PSA) from export and import documents submitted to the Bureau of Customs (BOC) by exporters and importers or their authorized representatives as required by law. The PSA regularly collects these documents, which are as follows:
- Export Declaration (ED – DTI form);
- Import Entry and Internal Revenue Declaration (BOC IEIRD Form 236);
- Informal Import Declaration and Entry (BOC Form 177); and
- Single Administrative Documents (SAD)
The digitized copies of all documents are provided by BOC and PEZA to PSA on a monthly basis through email.
The output of the Automated Export Documentation System (AEDS) of the BOC is being utilized to generate export statistics. AEDS is a paperless transaction in lieu of the manual filling up of export documents.
Moreover, an electronic copy of the IEIRD, or SAD, is utilized to capture the monthly import figures. SAD-IEIRD is an on-line submission of import documents either by brokers or companies. These are transactions that pass through the Automated Cargo Operating System (ACOS), now called the e2m (electronic to mobile) customs system, which is implemented through the BOC e-Customs Project.
All documents (hard copies and e-files) received within the cut-off date, which is every 25th day of the month, are compiled, processed, summarized, analyzed and disseminated through monthly statistical tables and press releases. Processing includes coding, editing, review and validation of results. All documents received after the cut-off date are included in the generation of the revised monthly statistical tables which are available 10 to 15 working days after the press release date.
The press release for a reference month is due 40 days after the reference month. However, if the due date falls on a Saturday, release is made a day earlier (Friday). If it falls on a Sunday or Monday, the release is on Tuesday. If the release date falls on a holiday, the date of release is moved accordingly.
The 2015 Philippine Standard Commodity Classification (PSCC) is used to classify the commodities at 10-digit code level for statistical purposes.
Data requests on international merchandise trade statistics can be made at Philippine Statistics Authority, Economic Sector Statistics Service, Trade Statistics Division (telephone number: (02) 8376-19-75 or at email address, j.soliven@psa.gov.ph).
See more at the Foreign Trade landing page.
