
Highlights of the Philippine Export and Import Statistics April 2024 (Preliminary)
MERCHANDISE EXPORT PERFORMANCE*
March 2013
(Preliminary)

* Include transactions that passed through Automated Export Documentation System (AEDS).
p - preliminary
r - revised
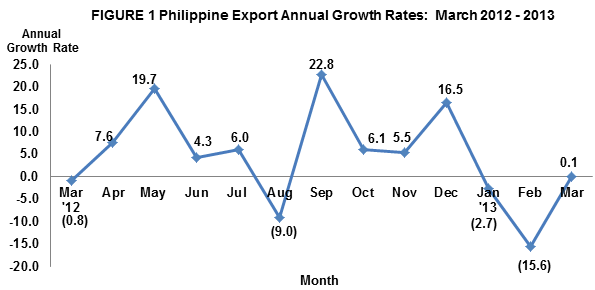
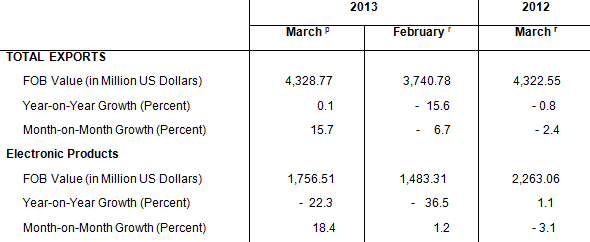
MERCHANDISE EXPORTS FOR MARCH 2013 UP BY 0.1 PERCENT
Export earnings in March 2013 amounted to $4.329 billion, a 0.1 percent increment from $4.322 billion recorded in March of 2012. Similarly, on a monthly basis, it increased by 15.7 percent from $3.741 billion posted in February 2013. The positive growth was supported by six major commodities out of the top ten commodities for the month. These are other mineral products, other manufactures, metal components, woodcrafts and furniture, coconut oil and ignition wiring set and other wiring sets used in vehicles, aircrafts and ships. Aggregate merchandise exports for the first three months of 2013 showed a decrease of 6.2 percent from $12.876 billion in 2012 to $12.080 billion in 2013.
ELECTRONIC PRODUCTS DECREASES BY 22.4 PERCENT
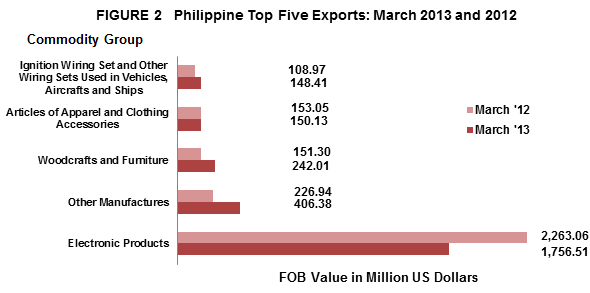
Accounting for 34.4 percent of the total exports revenue in March 2013, Electronic Products emerged as the country’s top export with total receipts of $1.757 billion. It went down by 22.4 percent from $2.263 billion registered in March 2012. However, month-on-month, Electronic Products, was up by 18.4 percent from $1.483 billion posted in February 2013. Components/Devices (Semiconductors) which comprised 30.1 percent of the total exports shared the biggest among the major groups of electronic products with export earnings worth $1.491 billion or a decrease of 10.8 percent from $1.672 billion registered in March 2012. Similarly, volume of outward shipments of electronic products and semiconductors also declined by 19.2 percent and 13.6 percent, respectively compared to same period a year ago.
Other Manufactures recorded as the country’s second top export with revenue valued at $406.38 million or 9.4 percent share to total exports. It increased by 79.1 percent compared to $226.94 million in same period a year ago. Likewise, outward shipments of this product showed a contraction of 53.5 percent compared to its year ago recorded shipment.
Ranked third in March 2013 and contributing 5.6 percent share to the total export receipts was Woodcrafts and Furniture with earnings amounting to $242.01 million. This figure expanded by 60.0 percent from its year ago level of $151.30 million. Furthermore, volume of shipments of this commodity showed a 84.5 percent increase compared to last year same month period.
Articles of Apparel and Clothing Accessories, with 3.5 percent share to the total export receipts, ranked fourth with value posted at $150.13 million. It slightly went down by 1.9 percent from $153.05 million recorded value in March 2012. Furthermore, volume of shipments of this commodity showed a 3.1 percent increase compared to last year same month period.
Ignition Wiring Set and Other Wiring Sets Used in Vehicles, Aircrafts and Ships Oil consists only of electrical wiring harness for motor vehicles with export revenue of $148.41 million, up by 36.2 percent followed as the fifth top export earner in March 2013. Moreover, volume of this product grew by 42.6 percent compared to the same period last year.
Rounding up the list of the top ten exports for the month of March 2013 were Metal Components with export earnings of $145.11 million, up by 73.4 percent; Machinery and Transport Equipment Chemicals with export receipts of $144.08 million decelerating by 32.2 percent; Coconut Oil with recorded sales amounting to $128.71 million higher by 43.0 percent; Chemicals with proceeds billed at $123.67 million falling by 29.8 percent; and Other Mineral Products with total receipts of $116.19 million or a share of 2.8 percent to the total exports revenue. It rose by 119.6 percent and registering the highest annual increase among the top ten exports from $52.91 million recorded value during the same month in 2012.
Total receipts from the top ten exports reached $3.361 billion, or 77.7 percent of the total exports.
EXPORTS OF MANUFACT URED GOODS STANDS AT $3.514 BILLION
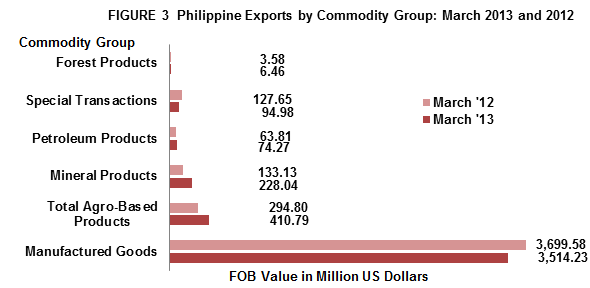
Accounting for 81.2 percent of the total export receipts in March 2013, outward shipments of Manufactured Goods was estimated at $3.514 billion, representing a decrease of 5.0 percent from $3.700 billion recorded in March 2012. On the other hand, on a monthly basis, it went up by 10.8 percent from $3.173 billion recorded in February 2013. Outward shipments in terms of gross kilos showed a negative year-on-year change of 36.1 percent compared to shipment in March 2012 and 6.9 percent increase in volume of shipment compared to last month.
Income from Total Agro-Based Products comprising 9.5 percent share of the total exports revenue in March 2013 went up by 39.3 percent to $410.79 million from $294.80 million. Compared to its previous month level, it also grew at 19.5 percent from $343.89 million in February 2013. Likewise, volume of shipments grew by 47.0 percent compared to same month a year ago.
Earnings from Mineral Products, with a share of 5.3 percent in March 2013, reached $228.04 million. It inflated by 71.3 percent from $133.13 million in March 2012. On the contrary, export receipts from Special Transactions reflecting 2.2 percent share,declined by 25.6 percent from $127.65 million in March 2012 to $94.98 million in March 2013. On the other hand, recorded volume of outward shipments for mineral products and special transactions registered a positive growth of 123.5 percent and 2,456.4 percent, respectively.
Petroleum Products accounting for 1.7 percent share of the total exports revenue accelerated by 16.4 percent to $74.27 million from $63.81 million reported value a year ago. Similarly, recorded volume of this product grew by 74.5 percent compared to same month in 2012. Likewise, Forest Products with 0.1 percent share grew by 80.6 percent to $6.46 million in March 2013 from $3.58 million in March 2012. Also, outward shipments of this product in terms of gross kilos were up by 116.9 percent compared to last year’s recorded volume.
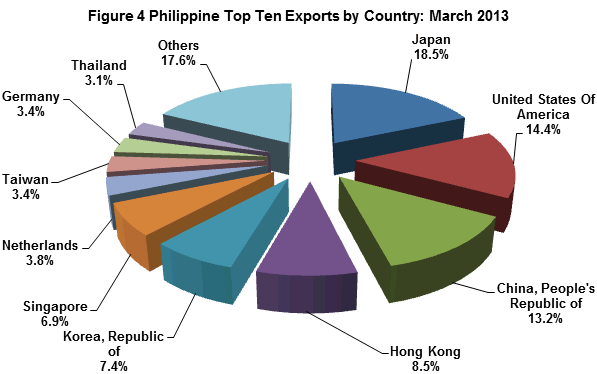
JAPAN ACCOUNTS FOR 18.5 PERCENT
Japan including Okinawa comprising 18.5 percent share to total exports for March 2013, emerged as the country’s top destination of exports with revenue amounting to $801.69 million. It was higher by 17.0 percent from $685.17 million recorded a year ago. Electronic products particularly components/devices (semiconductors), woodcrafts and furniture, and bananas are the goods mostly exported to Japan.
United States of America (USA) including Alaska and Hawaii, accounting for 14.4 percent share to total exports followed as the second top market of the country for March 2013 with export earnings worth $621.44 million. This represents a decrease of 7.0 percent from $668.25 million reported a year earlier. Products exported to USA comprised mostly of electronics and coconut oil.
People’s Republic of China for 13.2 percent share to total exports came in third with shipments amounting to $570.19 million. Compared to same month a year ago, this value contracted by 11.2 percent from $642.07 million. The export items to China consist mainly of mineral products and semiconductors.
Hong Kong ranked fourth in March 2013 with $366.31 million or 8.5 percent share of the total exports which decreased by 6.6 percent from it’s year ago amount of $392.12 million. Goods mostly exported to Hong Kong were components/devices (semiconductors).
Fifth in rank and representing 7.4 percent share to total exports was Republic of Korea with export earnings worth $318.72 million or an increase of 146.8 percent from $129.13 million posted in March 2012. Mineral products were goods mostly exported to Korea.
Other top ten markets for March 2013 were Singapore, $298.44 million; Netherlands, $165.53 million; Taiwan, $146.72 million; Germany, $145.28 million; and Thailand, $133.98 million.
Total export receipts from the country’s top ten markets for the month of March 2013 amounted to $3.568 billion or 82.4 percent of the total.
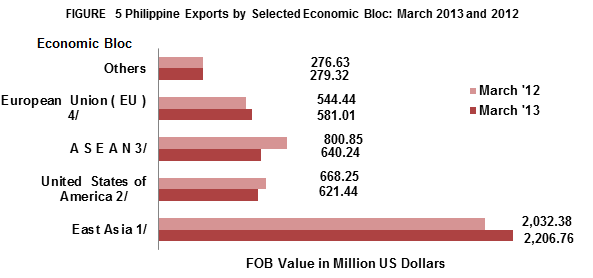
EXPORTS TO EAST ASIA WORTH $2.207 BILLION
The merchandise exports of the Philippines to East Asia in March 2013 accounted 51.0 percent share to total exports, amounting to $2.206 billion or an increase of 8.6 percent from its March 2012 figure of $2.032 billion.
Exports to ASEAN member-countries, accounting for 14.8 percent share to total merchandise exports in March 2013 reached $640.24 million, a 20.1 percent decline from $800.85 million recorded in March 2012.
Merchandise exports to European Union (EU), on the other hand, sharing 13.4 percent to total merchandise exports in March 2013, was valued at $581.01 million. It expanded by 6.7 percent from $544.44 million posted in March 2012.
Notes:
1/ - includes China, Hong Kong, Japan, Macau, Mongolia, N, Korea, S. Korea, Taiwan
2/ - includes Brunei Darussalam, Cambodia, Indonesia, Laos, Malaysia, Myanmar, Singapore, Thailand, Vietnam
3/ - includes Alaska and Hawaii
4/ - includes Austria, Belgium, Bulgaria, Cyprus, Czech Republic, Denmark, Estonia, Finland, France, Germany, Greece,
Hungary, Ireland, Italy, Latvia, Lithuania, Luxembourg, Malta, Netherlands, Poland, Portugal, Romania, Slovakia,
Slovenia, Spain, Sweden and UK Great Britain
Technical Note:
Starting with the February 2007 Press Release, analysis and tables are based on the 2004 Philippine Standard Commodity Classification (PSCC) groupings. This is in compliance with NSCB Resolution No. 03, Series of 2005 entitled “Approving and Adopting the 2004 Philippine Standard Commodity Classification” by all concerned government agencies and instrumentalities.
CARMELITA N. ERICTA
Administrator
Source: Foreign Trade Statistics Section
Industry and Trade Statistics Department
National Statistics Office
Manila, Philippines
