
Highlights of the Philippine Export and Import Statistics April 2024 (Preliminary)
EXTERNAL TRADE PERFORMANCE
JUNE 2013
(Preliminary)
p-preliminary
r-revised

JUNE 2013 TOTAL TRADE STAND AT $9.350 BILLION
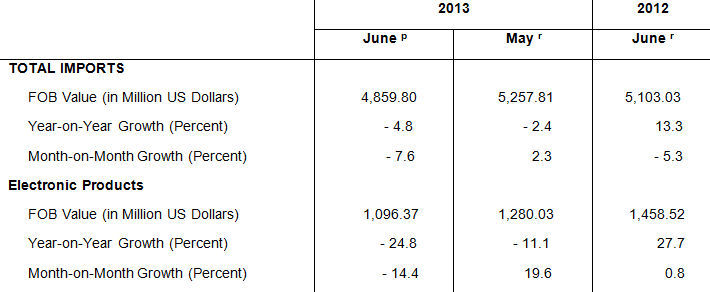
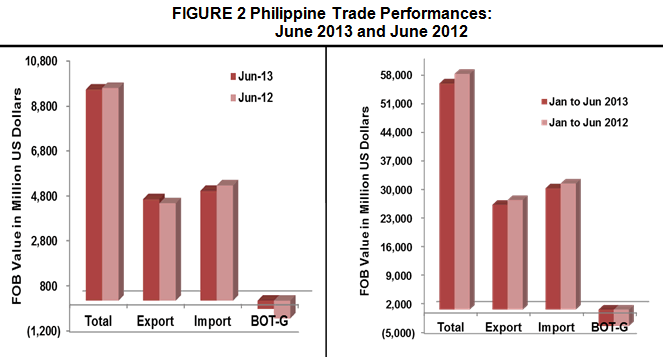
Total external trade in goods for June 2013 reached $9.350 billion, representing a 0.7 percent decline from $9.417 billion recorded during the same month in 2012. This was due to the 4.8 percent downward trend of total imports from $5.103 billion to $4.860 billion in June 2013. However, exports showed an increase of 4.1 percent to $4.490 billion from $4.314 billion in the same month a year ago. Thus, the balance of trade in goods (BOT-G) for the Philippines in June 2013 registered a deficit of $370 million from $789 million deficit in the same period last year.
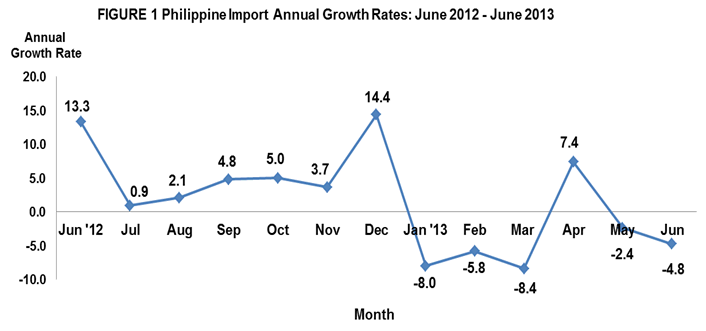
JUNE 2013 IMPORTS DOWN BY 4.8 PERCENT
The country’s total merchandise imports for this month went down by 4.8 percent from $5.103 billion in June 2012 to $4.860 billion in June 2013. Similarly, it decreased by 7.6 percent from $5.258 billion compared to previous month’s level. The negative growth was brought about by six out of 10 major commodity groups whose year-on-year change was negative. These were as follows: transport equipment; electronic products; cereals and cereal preparations; telecommunication equipment and electrical machinery; iron and steel; and plastics in primary and non-primary forms. Similarly, aggregate imports for the first six months of 2013 amounting to $29.615 billion showed a 3.8 percent decline compared with $30.786 billion in the same six months of last year.
ELECTRONIC PRODUCTS ACCOUNT FOR 22.6 PERCENT OF IMPORT BILL
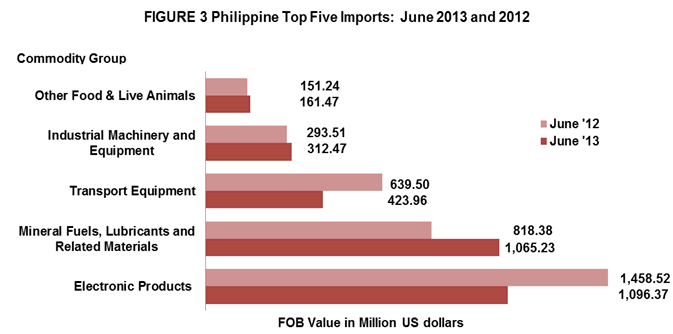
Accounting for 22.6 percent of the aggregate import bill, Electronic Products was the top imported commodity in June 2013 with payments amounting to $1.096 billion. It fell by 24.8 percent over last year's figure of $1.459 billion. On a monthly basis, it dropped by 14.3 percent from $1.280 billion recorded in May 2013. Volume of shipment of this product also went down by 7.3 percent compared to June 2012 and 13.2 percent decreased compared to May 2013. Among the major groups of electronic products, Components/Devices (Semiconductors), having the biggest share of 16.7 percent, decreased by 28.7 percent from $1.139 billion in same month a year ago to $812.47 million in June 2013.
Imports of Mineral Fuels, Lubricants and Related Materials ranked second with 21.9 percent share and registering the highest annual growth rate of 30.2 percent among the top ten imports with reported value of $1.065 billion in June 2013 compared from $818.38 million in June 2012. Shipment of this product in terms of volume grew by 23.6 percent compared to its recorded volume in June 2012.
Transport Equipment was the PH’s third top import for the month with 8.7 percent share to total imports valued at $423.96 million in June 2013. This figure was 33.7 percent lower than the previous year’s level of $639.50 million. However, compared to previous month, import grew by 33.8 percent from $316.80 million in May 2013. Volume of this product compared with previous year recorded volume rose by 23.8 percent.
Industrial Machinery and Equipment, contributing 6.4 percent to the total import bill was the PH’s fourth top import for the month amounting to $312.47 million. It rose by 6.5 percent compared to last year’s value of $293.51 million. Likewise, the volume of shipment of this product accelerated by 21.1 percent compared with same period last year.
Fifth in rank and with 3.3 percent share to the total imports, Other Food and Live Animals recorded $161.47 million worth of imports, higher by 6.8 percent from its year ago level of $151.24 million. Inward shipments in terms of gross kilos registered a positive year-on-year change of 6.2 percent.
Rounding up the list of the top ten imports for June 2013 were Plastics in Primary and Non-Primary Forms valued at $125.77 million; Organic and Inorganic Chemicals amounting to $115.62 million; Cereals and Cereal Preparations, $115.28 million; Iron and Steel, $113.77 million; and Telecommunication Equipment and Electrical Machinery, $93.48 million.
Aggregate payment for the country’s top ten imports for June 2013 reached $3.623 billion or 74.6 percent of the total import bill.
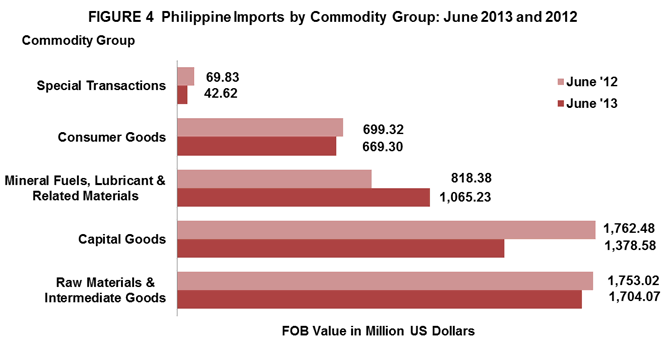
RAW MATERIALS AND INTERMEDIATE GOODS ACCOUNT FOR 35.1 PERCENT OF THE TOTAL IMPORTS
Accounting for 35.1 percent of the total imports, payments in June 2013 for Raw Materials and Intermediate Goods amounted to $1.704 billion or a 2.8 percent decrement over last year's figure of $1.753 billion. Compared to the previous month’s level, purchases also went down by 23.2 percent from $2.220 billion. Semi-Processed Raw Materials had the biggest share of 31.0 percent and valued at $1.504 billion. However, volume of inward shipments of raw materials and intermediate goods grew by 25.7 percent compared with same month a year ago.
Imports of Capital Goods, comprising 28.4 percent of the total imports, dropped by 21.8 percent from $1.762 billion in June 2012 to $1.379 billion in June 2013. On the other hand, volume of inward shipments for this product was up by 19.2 percent compared to same month a year ago.
Mineral Fuels, Lubricants and Related Materials with 21.9 percent share to total imports expanded by 30.2 percent to $1.065 billion in June 2013 from $818.38 million in June 2012. Likewise, volume of shipment of this product grew by 23.6 percent.
Purchases of Consumer Goods registered a 4.3 percent reduction from $699.32 million in June 2012 to $669.30 million in June 2013. Special Transactions went down by 39.0 percent from $69.83 million to $42.62 million in June 2013. Moreover, in terms of volume of shipments, imports of consumer goods recorded a negative growth of 20.9 percent while imports of special transactions showed a positive growth of 11.9 percent compared with same month last year.
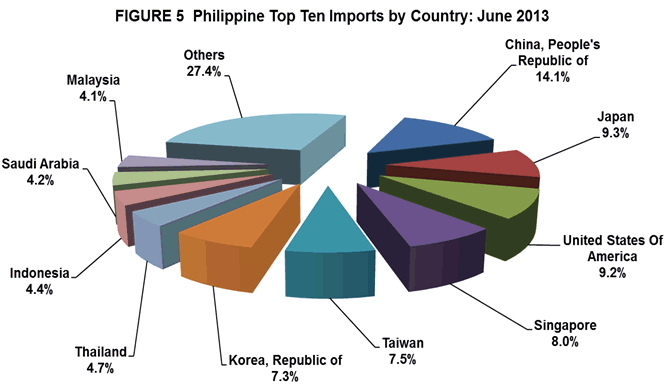
IMPORTS FROM PEOPLE’S REPUBLIC OF CHINA ACCOUNT FOR 14.1 PERCENT
People’s Republic of China was the country’s biggest source of imports for June 2013 with 14.1 percent share of the total import bill, higher by 25.8 percent to $685.16 million from $544.85 million in June 2012. The increase was attributed to the purchases of telecommunication equipment and electrical machinery and other mineral fuels and lubricants. Exports to China amounted to $613.92 million, yielding a two-way trade value of $1.299 billion and a trade deficit for PH of $71.24 million.
Japan including Okinawa was the second biggest source of imports with 9.3 percent share. Payments were recorded at $453.73 million, a decrease of 25.5 percent from $609.17 million in June 2012. Commodities imported from Japan were mostly telecommunication equipment and electrical machinery, transport equipment and electronic products. Revenue from PH’s exports to Japan, on the other hand, reached $985.15 million, generating a total trade value of $1.439 billion and $531.41 million trade surplus for the Philippines.
United States of America (USA) including Alaska and Hawaii came third, accounting for about 9.2 percent share of the total import bill in June 2013 with a negative growth of 44.7 percent from $803.62 million to $444.74 million. Electronic products were the recorded imported goods from USA. Exports to USA amounted to $633.05 million resulting to a total trade value of $1.078 billion and a trade surplus of $188.31 million.
Singapore settled fourth accounting for 8.0 percent share of the total import bill in June 2013 or an increase of 18.7 percent to $386.61 million in June 2013 from $325.64 million in June 2012. Commodities purchased from Singapore in June 2013 were other mineral fuels and lubricants, electronic products and other food and live animals. Exports to Singapore amounted to $389.01 million resulting to a total trade value of $775.62 million and a trade surplus of $2.40 million.
Fifth in rank was Taiwan, representing a 7.5 percent of the total import bill in June 2013 amounting to $362.67 million. Other mineral fuels and lubricants, telecommunication equipment and electrical machinery and iron and steel were the imported goods from Taiwan. Meanwhile, export receipts from Taiwan in June 2013 reached $140.75 million yielding a total trade value of $503.41 million and a trade deficit of $221.92 million.
Other major sources of imports for the month of June 2013 were Republic of Korea, $353.57 million; Thailand $227.77 million; Indonesia, $211.45 million; Saudi Arabia, $203.68 million; and Malaysia, $197.83 million.
Payments for imports from the top ten sources for June 2013 amounted to $3.527 billion or 72.6 percent of the total.
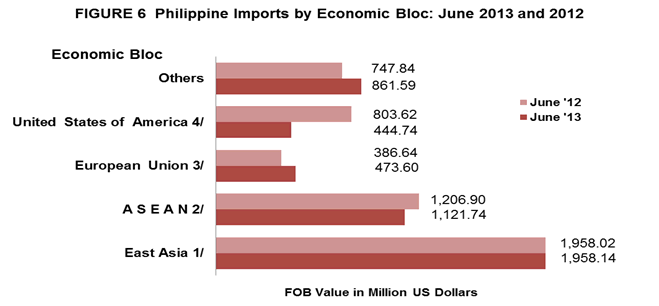
IMPORTS FROM EAST ASIA WORTH $1.958 BILLION
Philippines’ total imports in June 2013 with East Asia (China, Hong Kong, Japan, Macau, Mongolia, North Korea, South Korea and Taiwan) accounted for 40.3 percent of the county’s total imports with total payments of $1,958.14 million, higher by 0.01 percent from $1,958.02 million in June 2012. Total exports to member-countries of East Asia were valued at $2.329 billion resulting to a total trade of $4.287 billion and a balance of trade in goods (BOT-G) surplus of $370.46 million.
June 2013 imports from ASEAN member-countries registered at $1.122 billion, contributed 23.1 percent share, lower by 7.1 percent from $1.207 billion registered in June 2012. Exports to ASEAN member-countries worth $752.14 million, resulting to a total trade of $1.874 billion and a trade deficit of $369.60 million.
Imports from European Union were valued at $473.60 million. It expanded by 22.5 percent compared to a year ago recorded value of $386.64 million while exports to member-countries of European Union were worth $486.85 million. This aggregated to total trade of $960.45 million and a trade surplus of $13.25 million.
Notes:
1/ - includes China, Hong Kong, Japan, Macau, Mongolia, N, Korea, S. Korea, Taiwan
2/ - includes Brunei Darussalam, Cambodia, Indonesia, Laos, Malaysia, Myanmar, Singapore, Thailand, Vietnam
3/ - includes Austria, Belgium, Bulgaria, Cyprus, Czech Republic, Denmark, Estonia, Finland, France, Germany,
Greece, Hungary, Ireland, Italy, Latvia, Lithuania, Luxembourg, Malta, Netherlands, Poland, Portugal,
Romania, Slovakia, Slovenia, Spain, Sweden and UK Great Britain
4/ - includes Alaska and Hawaii
Technical Notes:
- Adjustments on electronic import statistics are based on the transactions that pass through the Electronic to Mobile (e2m) of the Bureau of Customs (BOC).
- Starting with the 2007 Press Release, analysis and tables are based on the 2004 Philippine Standard Commodity Classification (PSCC) groupings. This is in compliance with NSCB Resolution No. 03, Series of 2005 entitled “Approving and Adopting the 2004 Philippine Standard Commodity Classification” by all concerned government agencies and instrumentalities.
CARMELITA N. ERICTA
Administrator
Source: Foreign Trade Statistics Section
Industry and Trade Statistics Department
National Statistics Office
Manila, Philippines
