
Highlights of the Philippine Export and Import Statistics April 2024 (Preliminary)
MERCHANDISE EXPORTS PERFORMANCE
APRIL 2015
(Preliminary)
|
|
April
|
||
|---|---|---|---|
|
|
2015 p |
2014 r |
|
|
TOTAL EXPORTS FOB Value in Million US Dollars Year-on-Year Growth (Percent) Electronic Products FOB Value in Million US Dollars Year-on-Year Growth (Percent) |
4,376.35 -4.1
2,216.48 17.8 |
4,563.49 1.3
1,881.41 1.0 |
|
|
Top 10 Philippine Export to All Countries: April 2015 p
(Year-on-Year Growth in Percent)
|
|||
|---|---|---|---|
Gainers |
Losers |
||
|
Coconut Oil
|
30.3 |
Other Mineral Products
|
-36.8 |
|
Electronic Products
|
17.8 |
Other Manufactures
|
-26.7 |
|
|
Woodcrafts and Furniture
|
-23.9 | |
|
|
Metal Components
|
-14.5 | |
|
|
Chemicals
|
-10.2 | |
|
|
Ignition Wiring Set and Other Wiring Sets Used in Vehicles, Aircrafts and Ships
|
-7.9 | |
|
|
Articles of Apparel and Clothing Accessories
|
-4.9 | |
|
Machinery and Transport Equipment
|
-4.4 | ||
p-preliminary, r-revised
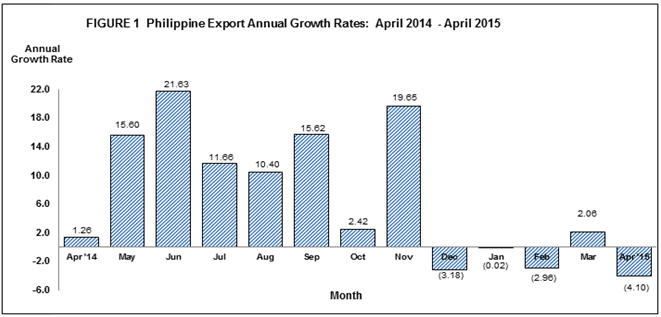
OUTBOUND GOODS IN APRIL 2015 DECREASED BY 4.1 PERCENT
The Philippines’ export sales totaled $4.376 billion in April 2015, a 4.1 percent decrease from $4.563 billion recorded value in April of 2014. The negative growth was mainly brought about by the decrease of eight major commodities out of the top ten commodities for the month which include other mineral products; other manufactures; woodcrafts and furniture; metal components; chemicals; ignition wiring set and other wiring sets used in vehicles, aircrafts and ships; articles of apparel and clothing accessories; and machinery & transport equipment (Table 1).
Combined merchandise exports for the four month period of 2015 registered a 1.2 percent decrease that is from $18.840 billion in 2014 to $18.623 billion in same period of 2015 (Table 1a).
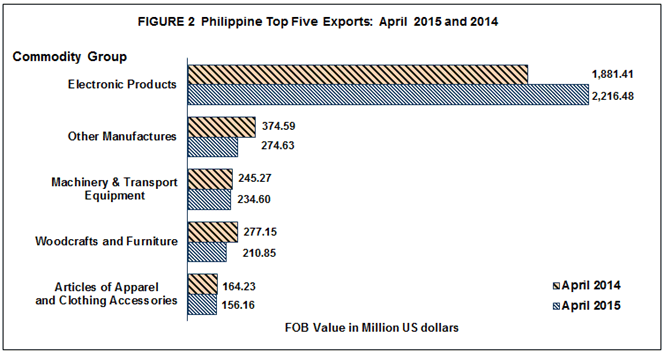
ELECTRONIC PRODUCTS GREW BY 17.8 PERCENT
Electronic Products remained as the country’s top export with total receipts of $2.216 billion, accounting for 50.6 percent of the total exports revenue in April 2015. It increased by 17.8 percent from $1.881 billion registered in April 2014. Among the major groups of electronic products, Components/Devices (Semiconductors), comprised the biggest at 38.1 percent. Its total exports earnings worth $1.667 billion and rose by 26.7 percent from $1.316 billion recorded in April 2014.
Other Manufactures, with 6.3 percent share to the total export receipts, ranked second with value posted at $274.63 million. This recorded a decrease of 26.7 percent from April 2014 value of $374.59 million.
Machinery and Transport Equipment was the third top export earner in April 2015 with export revenue of $234.60 million, declined by 4.4 percent from $245.27 million in April 2014.
Woodcrafts and Furniture recorded as the country’s fourth top export with revenue valued at $210.85 million or 4.8 percent share to total exports. It contracted by 23.9 percent from $277.15 million in same period of 2014.
Articles of Apparel and Clothing Accessories ranked fifth, with sales amounting to $156.16 million in April 2015, contributing 3.6 percent share to the total export receipts. This registered a 4.9 percent decrease from the previous year level of $164.23 million.
Rounding up the list of the top ten exports for the month of April 2015 were: Chemicals with export earnings of $151.94 million, fell by 10.2 percent; Ignition Wiring Set and Other Wiring Sets Used in Vehicles, Aircrafts and Ships with export receipts of $148.70 million, dropped by 7.9 percent; Other Mineral Products with proceeds billed at $138.85 million, declined by 36.8 percent; Coconut Oils with export receipts of $81.09 million, expanded by 30.3 percent and registered the highest year-on-year increase among the top ten exports during this period; and Metal Components with total receipts of $80.28 million, decelerated by 14.5 percent.
Total receipts from the top ten exports reached $3.694 billion, or 84.4 percent of the total exports.
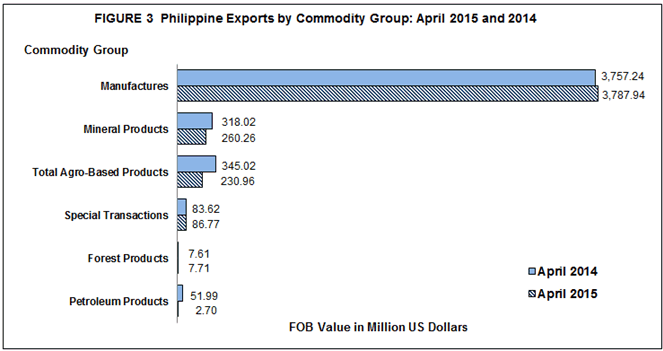
EXPORTS OF MANUFACTURED GOODS UP BY 0.8 PERCENT
Outward shipments of Manufactured Goods were valued at $3.788 billion, accounting for 86.6 percent of the total export receipts in April 2015. It went up by 0.8 percent from $3.757 billion recorded in April 2014 (Table 2).
Mineral Products which registered a 5.9 percent share, decreased by 18.2 percent from $318.02 million in April 2014 to $260.26 million in April 2015.
Receipts from Total Agro-Based Products, with a share of 5.3 percent in April 2015, amounted to $230.96 million. It dropped by 33.1 percent from $345.02 million in April 2014.
Merchandise exports from Special Transactions, which comprised 2.0 percent share of the total exports revenue in April 2015, rose by 3.8 percent to $86.78 million from $83.62 million in same month a year ago.
Sales from Forest Products which accounted for 0.2 percent share of the total exports, increased by 1.3 percent to $7.71 million in April 2015 from $7.61 million reported value in same period of 2014.
Furthermore, Petroleum Products with 0.1 percent share, declined by 94.8 percent from $51.99 million in April 2014 to $2.70 million in same month in 2015.
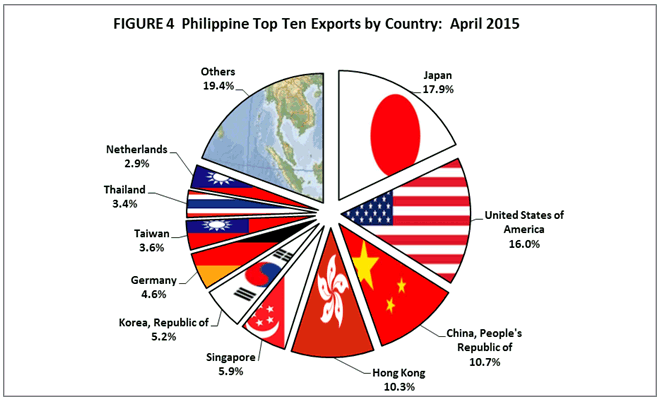
JAPAN ACCOUNTED FOR 17.9 PERCENT TO TOTAL EXPORTS
Japan including Okinawa remained as the country’s top destination of exports with revenue amounting to $784.90 million, comprising 17.9 percent share to total exports for April 2015. It decreased by 16.1 percent from $935.29 million recorded value in same month a year ago.
United States of America (USA) including Alaska and Hawaii ranked second, accounting 16.0 percent to total exports, with export receipts valued at $700.21 million in April 2015. This recorded a decline of 5.4 percent from $740.01 million in same month last year.
People’s Republic of China with 10.7 percent share to total exports, ranked third with shipments valued at $467.67 million in April 2015. It went down by 17.9 percent from $569.53 million in same month a year ago.
Hong Kong ranked fourth in April 2015 with $451.07 million or 10.3 percent share of the total exports. It rose by 22.8 percent from $367.23 million year ago level.
Singapore placed fifth, representing a 5.9 percent share to total exports, with export earnings worth $260.16 million. It contracted by 33.2 percent from $389.26 million posted in April 2014.
Other top ten market destinations for April 2015 were: Republic of Korea, $229.55 million; Germany, $202.49 million; Taiwan, $159.37 million; Thailand, $148.41 million; and Netherlands, $125.43 million.
Total export receipts from the country’s top ten market destinations for the month of April 2015 was valued at $3.529 billion or 80.6 percent of the total (Table 3).
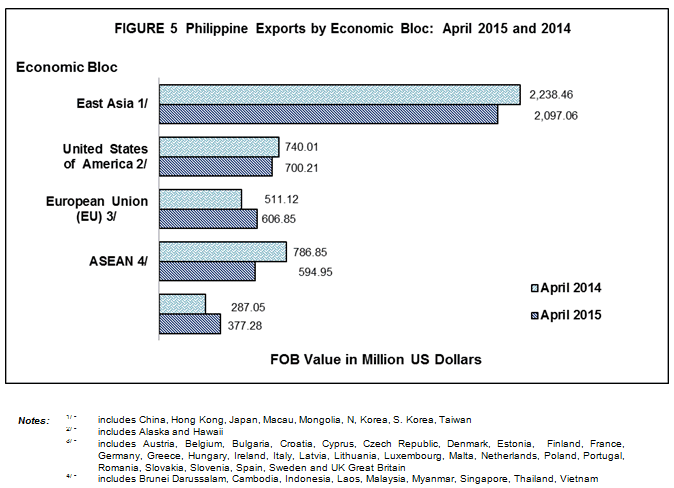
47.9 PERCENT OF EXPORTS WERE FROM COUNTRIES IN EAST ASIA
The bulk of country’s merchandise exports in April 2015 were from countries in East Asia which accounted for 47.9 percent share to total exports and valued at $2.097 billion. It decreased by 6.3 percent from $2.238 billion of April 2014 figure.
Exports to European Union member countries, with 13.9 percent share to total merchandise exports amounted to $606.85 million. It grew by 18.7 percent from $511.12 million recorded in April 2014.
Commodities exported to ASEAN member countries comprised 13.6 percent of the total exports in April 2015 and was valued at $594.95 million. This registered a decrease of 24.4 percent from $786.85 million posted in same month a year ago (Table 3a).
Technical Notes:
1.) Starting with the April 2007 Press Release, analysis and tables are based on the 2004 Philippine Standard Commodity Classification (PSCC) groupings. This is in compliance with the former NSCB Resolution No. 03, Series of 2005 entitled “Approving and Adopting the 2004 Philippine Standard Commodity Classification” by all concerned government agencies and instrumentalities.
2.) Starting 2014 export revised FOB value, all transactions that pass through all Value Added Service Providers (VASPs) of Bureau of Customs (BOC) and Philippine Economic and Zone Authority (PEZA) were included. Physical export declaration and electronic data files were the basis of export statistics.
(Sgd.) LISA GRACE S. BERSALES, Ph. D.
National Statistician
