
Highlights of the Philippine Export and Import Statistics April 2024 (Preliminary)
January to October total trade stands at $60.595 billion
Total external trade in goods for January to October 2003 amounted to $60.595 billion or 3.0 percent higher than $58.807 billion during the same period a year earlier. The bill for foreign-made merchandise increased by 5.0 percent to $31.106 billion from $29.616 billion. Likewise, exports recorded a year-on-year growth rate of 1.0 percent to an aggregate dollar revenue of $29.489 billion from $29.191 billion a year ago. Balance of trade in goods (BOT-G) deficit for the Philippines reached $1.617 billion, higher than last years value of $424 million.
Figure 1A. Philippine Trade Performance in January - October : 2002 and 2003
(F.O.B. Value in Million US Dollar)
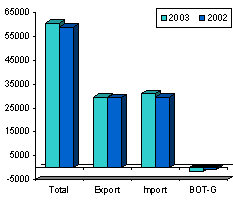
Figure 1B. Philippine Trade Performance: October: 2002 and 2003
(F.O.B. Value in Million US Dollar)
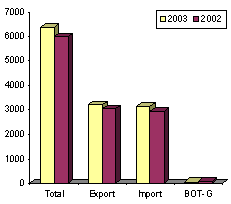
October imports up by 7.0 percent
Total merchandise trade for October 2003 went up by 6.6 percent to $6.377 billion from $5.980 billion during the same period last year. Dollar-inflow generated by exports amounted to $3.223 billion, or 6.3 percent greater than last years $3.033 billion. Similarly, expenditures for imported goods grew by 7.0 percent to $3.154 billion from $2.946 billion. The BOT-G surplus for the Philippines was registered at $69 million, compared to last years figure at $87 million.
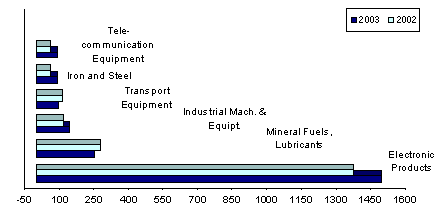
Electronic products account for 47.4 percent of import bill
Accounting for 47.4 percent of the total aggregate import bill, payments for electronic products amounted to $1.496 billion or 8.9 percent higher than last year's $1.374 billion. Compared to the previous month, dollar-outflow moved up by 4.3 percent from $1.434 billion.
Purchases of mineral fuels, lubricants and related materials ranked second with 8.0 percent share. Expenditures at $251.44 million, registered a 9.2 percent decrease over the previous level which stood at $276.91 million.
Industrial machinery and equipment, the third top import reported purchases worth $142.98 million, or an 18.4 percent increase from $120.78 million last year.
Transport equipment accounting for 3.0 percent of the total imports, ranked fourth as foreign bill amounted to $95.94 million, a decline of 13.0 percent from last year's $110.28 million.
Iron and steel, contributing 2.8 percent to the total bill, was RPs fifth top import for the month with payments placed at $89.68 million or 50.7 percent higher than last years $59.49 million.
Expenditures for telecommunication equipment and electrical machinery, with a 2.8 percent share to the aggregate bill, gained by 43.0 percent to $88.45 million from $61.84 million in October 2002.
Rounding up the list of the top imports for October 2003 were: textile yarn, fabrics, made-up articles and related products, $78.05 million; cereals and cereal preparation, $71.80 million; plastics in primary and non-primary forms, $68.79 million; and organic and inorganic chemical, $54.38 million.
Aggregate payment for the countrys top ten imports for October 2003 amounted to $2.437 billion or 77.3 percent of the total bill.
Figure 2. Philippine Top Imports in October 2002 and 2003
(F.O.B. Value in Million US Dollar)
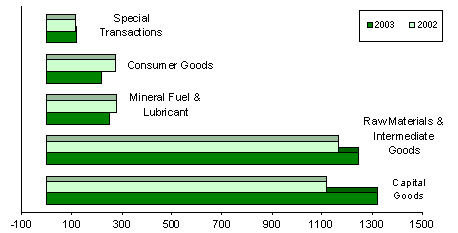
Capital goods account for 41.8 percent of the total import bill
Capital goods comprising 41.8 percent of the aggregate bill climbed by 18.2 percent year-on-year to $1.320 billion from $1.116 billion. The biggest share went totelecommunication equipment and electrical machinery with a 22.6 percent share of the total and valued at $712.42 million.
Payments for raw materials and intermediate goods consisting of unprocessed raw materials and semi-processed raw materials accounted for 39.4 percent of the aggregate bill, as importation accelerated by 7.0 percent to $1.244 billion from last years reported figure of $1.163 billion.
Expenditures for mineral fuels, lubricants and related materials fell by 9.2 percent to $251.44 million from $276.91 million during the same period of 2002.
Purchases of consumer goods valued at $218.93 million slowed down by 19.8 percent from $272.86 million in October 2002, while special transactions climbed by 2.2 percent to $120.14 million from $117.58 million.
Figure 3. Philippine Imports by Major Type of Goods in October: 2002 and 2003
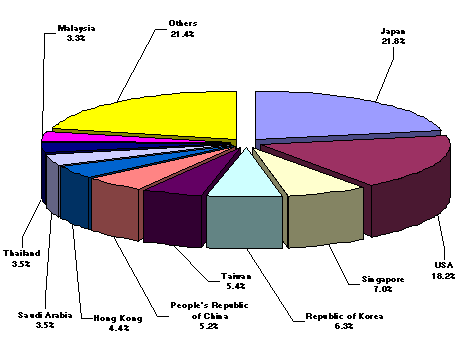
Japan corners 21.8 percent of october import bill
Imports from Japan accounting for 21.8 percent of the total import bill, inched up by 4.2 percent to $688.25 million from $660.72 million during the same period a year ago. On the other hand, exports to Japan, amounted to $589.84 million yielding a two-way trade value of $1.278 billion and a trade deficit for RP placed at $98.41 million.
United States, the countrys second biggest source of imports with an 18.2 percent share, reported shipments valued at $574.64 million against exports amounting to $522.05 million. Total trade amounted to $1.097 billion, with a trade deficit for the Philippines at $52.59 million.
Singapore, followed as RPs third biggest source of imports. With payments worth $219.08 million, imports from Singapore rose by 18.3 percent from $185.17 million, while revenue from RPs exports reached $230.62 million resulting to a total trade value of $449.70 million and a $11.55 million surplus for RP.
Other major sources of imports for the month of October were: Republic of Korea, $198.74 million; Taiwan, $170.78 million; Peoples Republic of China, $164.85 million; Hong Kong, $137.88 million; Saudi Arabia, $112.62 million; Thailand, $110.0 million; and Malaysia, $103.15 million.
Payments for imports from the top ten sources for the month amounted to $2.480 billion or 78.6 percent of the total.
Figure 4. Philippine Imports by Country in October: 2003
As of press time 81 out of 65,606 export documents and 65 out of 75,342 import documents are still expected from the ports.
Source: National Statistics Office
Manila, Philippines
