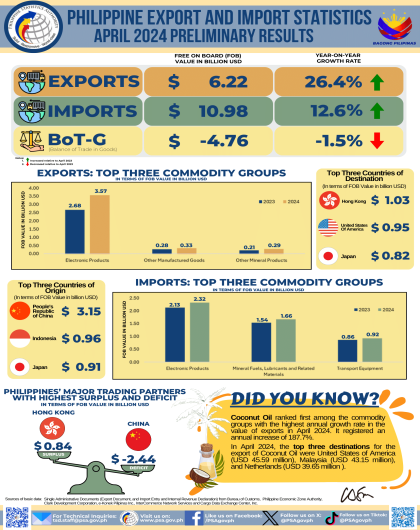
Highlights of the Philippine Export and Import Statistics April 2024 (Preliminary)
January to November total trade stands at $63.054 billion
Total external trade in goods for January to November 2002 amounted to $63.054 billion or 10.8 percent higher than $56.913 billion in 2001. The bill for foreign-made merchandise went up by 12.7 percent to $30.902 billion from $27.408 billion. On the other hand, exports posted a year-on-year growth rate of 9.0 percent to an aggregate dollar revenue of $32.152 billion from $29.505 billion a year earlier. Balance of trade surplus for the Philippines reached $1.251 billion or 40.4 percent lower than last year's $2.097 billion.
Figure 1A. Philippine Trade Performance
January - November: 2001 and 2002
(F.O.B. Value in Million US Dollar)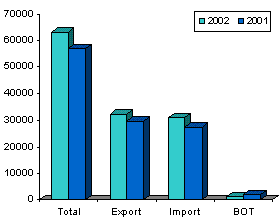
Figure 1B. Philippine Trade Performance
November: 2001 and 2002
(F.O.B. Value in Million US Dollar)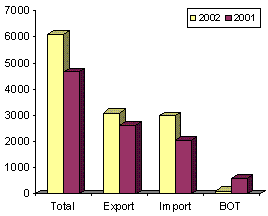
Note: The figures for electronics components in this summary report are still based on the "old series", that is, without adjusting for understatement. These will be revised after the release of the 2002 adjusted figures.
November imports increase by 46.5 percent
Total merchandise trade for November 2002 moved up by 30.4 percent to $6.089 billion from $4.668 billion during the same period a year ago. Dollar-inflow generated by exports amounted to $3.103 billion, or 18.0 percent higher than last year's $2.630 billion. On the other hand, expenditures for imported goods went up by 46.5 percent to $2.986 billion from $2.039 billion. The BOT-G surplus registered $118 million, or 80.1 percent lower compared to last year's $591 million.
Electronics and components account for 26.6 percent of import bill
Accounting for 26.6 percent of the total aggregate import bill, payments forelectronics and components amounted to $792.61 million or 137.2 percent higher than last year's $334.23 million. Compared to the previous month, dollar-outflow increased by 11.4 percent from $711.78 million.
Purchases of mineral fuels, lubricants and related materials ranked second with 11.3 percent share. Payments made placed at $337.85. million registered a 61.2 percent increase over the previous level which stood at $209.63 million.
Office and EDP machines, the third top import reported purchases worth $310.84 million, or a 71.5 percent increase from $181.25 million last year.
Telecommunication equipment and electrical machinery accounting for 7.7 percent of the total import bill, ranked fourth as payments amounted to $230.53 million, down by 5.5 percent from last year's $243.99 million.
Expenditures for transport equipment, contributing 4.7 percent share to the aggregate bill, increased by 70.8 percent to $139.0 million from $81.37 million in November 2001.
Industrial machinery and equipment, contributing 4.2 percent to the total bill, was RP's sixth top import for the month with payments posted at $123.97 million or 11.5 percent higher than last year's $111.16 million.
Rounding up the list of the top imports for November 2002 were: textile yarn, fabrics, made-up articles and related products, $81.40 million; iron and steel, $76.09 million; materials/accessories imported on consignment basis for the manufacture of other electrical and electronic machinery and equipment, $64.83 million; and organic and inorganic chemical,$59.75 million.
Aggregate payment for the country's top ten imports for November 2002 amounted to $2.217 billion or 74.2 percent of the total bill.
Figure 2. Philippine Top Imports in November 2001 and 2002
(F.O.B. Value in Million US Dollar)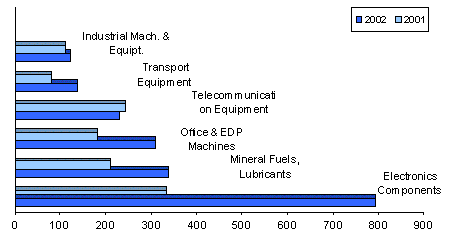
Capital goods account for 42.9 percent of the total import bill
Capital goods comprising 42.9 percent of the aggregate bill accelerated by 52.8 percent year-on-year to $1.282 billion from $839.25 million. The group was led by telecommunication equipment and electrical machineryvalued at $683.10 million or a 22.9 percent share of the total.
Payments for raw materials and intermediate goods consisting ofunprocessed raw materials and semiprocessed raw materialsaccounted for 34.8 percent of the aggregate bill as importation went up by 37.4 percent to $1.039 billion from last year's $756.26 million.
Expenditures for mineral fuels, lubricants and related materials increased by 61.2 percent to $337.85 million from $209.63 million after a year.
Purchases of consumer goods valued at $233.22 million, posted a 19.2 percent gain from $195.74 million in November 2001, while special transactions grew by 147.1 percent to $93.27 million from $37.74 million.
Figure 3. Philippine Imports by Major Type of Goods
November: 2001 and 2002
(F.O.B. Value in Million US Dollar)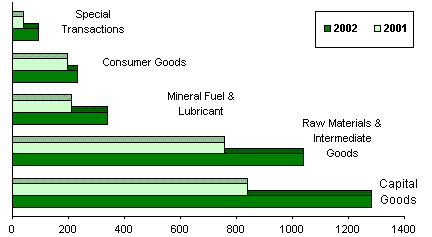
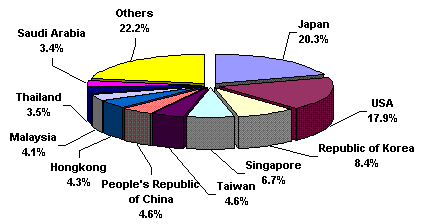
Japan corners 20.2 percent of November import bill
Purchases of Japanese made goods, accounting for 20.2 percent of the total import bill, went up by 33.2 percent to $604.55 million from $454.04 million a year earlier. Likewise, exports to Japan, posted at $493.99 million yielding a two-way trade figure of $1.098 billion and a trade deficit for RP placed at $110.56 million.
US, the country's second biggest source of imports with 17.9 percent share, reported shipments valued at $535.32 million against exports amounting to $665.50 million. Total trade amounted to $1.201 billion with trade surplus for the Philippines placed at $130.18 million.
Republic of Korea followed as RP's third biggest source of imports. With payments worth $251.74 million, imports from Korea increased by 51.0 percent from $166.72 million while revenue from RP�s exports reached $138.47 million resulting to a total trade value of $390.20 million and a $113.27 million deficit for RP.
Other major sources of imports for the month of November were Singapore, $200.63 million; Taiwan, $138.14 million; People's Republic of China,$137.17 million; Hongkong, $129.27 million; Malaysia, $121.20 million;Thailand, $103.74 million; and Saudi Arabia, $101.99 million.
Payments for imports from the top ten sources for the month amounted to $2.324 billion or 77.8 percent of the total.
Figure 4. Philippine Imports by Country in November: 2002
As of press time 49 out of 65,099 export documents and 105 out of 68,399import documents are still expected from the ports.
Source: National Statistics Office
Manila, Philippines

