
Highlights of the Philippine Export and Import Statistics April 2024 (Preliminary)
JANUARY TOTAL TRADE STANDS AT $4.641 BILLION
Total external trade in goods for January 2002 amounted to $4.641 billion or 13.4 percent lower than $5.361 billion in 2001. Bill for foreign-made merchandise declined by 18.7 percent to $2.010 billion from $2.472 billion. On the other hand, exports posted an 8.9 percent year-on-year decrease reporting an aggregate dollar revenue of $2.631 billion down from $2.889 billion a year earlier. Balance of trade surplus for the Philippines amounted to $621 million or 48.9 percent higher than last year's $417 million.
Fig. 1A.Philippine Trade Performance in January: 2001 & 2002
(F.O.B. Value in Million US Dollar)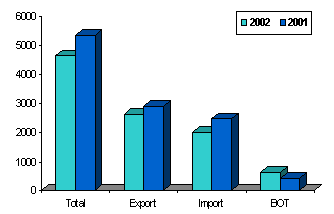
Compared to last month, total merchandise trade fell by 3.1 percent to $4.641 billion from $4.788 billion in December. Dollar-inflow generated by exports amounted to $2.631 billion, or a 0.5 percent decrease from last month's $2.645 billion, while expenditures for imported goods decreased by 6.2 percent to $2.010 billion from $2.143 billion.
ELECTRONICS AND COMPONENTS ACCOUNT FOR 18.4 PERCENT OF IMPORT BILL
Accounting for 18.4 percent of the total aggregate import bill, payments for Electronics and Components amounted to $370.48 million or 19.3 percent lower than last year's $458.78 million. Compared to the previous month, dollar-outflow decreased by 6.4 percent from $395.84 million.
Purchases of Telecommunication Equipment and Electrical Machinery ranked second with an 11.1 percent share. Payments made reached $223.94 million for an 11.3 percent slowdown over last year's $252.34 million.
Mineral Fuels, Lubricants and Related Materials, the third top import reported purchases worth $202.56 million, or a 32.1 percent decrease from $298.35 million a year earlier.
Office and EDP Machines accounting for 7.1 percent of the total bill, ranked fourth as payments reached $143.02 million, lower by 2.8 percent from last year's $147.11 million.
Industrial Machinery and Equipment accounting for 4.8 percent of the total bill, was RP's fifth top import for the month with payments worth $97.34 million or 39.6 percent lower than last year's $161.24 million.
Expenditures for Materials/Accessories Imported on Consignment Basis for the Manufacture of Other Electrical and Electronic Machinery and Equipment, combined for a 3.9 percent share of the aggregate bill, which decreased by 40.6 percent to $79.02 million from $132.92 million.
Rounding up the list of the top imports for January 2002 were: Textile Yarn, Fabrics, Made-up Articles and Related Products, $74.32 million; Transport Equipment, $74.30 million; Iron and Steel, $55.69 million; Cereals and Cereal Preparations, $46.12 million.
Aggregate payment for the country's top ten imports for January 2002 amounted to $1.367 billion or 68.0 percent of the total bill.
Fig. 2. Philippine Top Imports in January 2001 & 2002
(F.O.B. Value in Million US Dollar)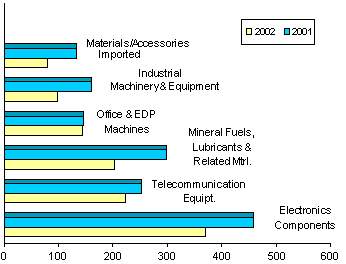
CAPITAL GOODS ACCOUNT FOR 38.9 PERCENT OF THE TOTAL IMPORT BILL
Capital Goods accounting for 38.9 percent of the aggregate bill dropped by 18.7 percent to $781.85 million from last year's $961.25 million. The group was led by Telecommunication Equipment and Electrical Machinery valued at $441.94 million or a 22.0 percent share of the total.
Payments for Raw Materials and Intermediate Goods consisting of unprocessed raw materials and semi-processed raw materials accounted for 38.6 percent of the aggregate bill even as importation went down by 19.1 percent to $776.36 million from $960.10 million.
Purchases of Mineral Fuel & Lubricant valued at $202.56 million, registered a 32.1 percent slowdown from $298.35 million.
Expenditures for Consumer Goods increased by 6.7 percent to $185.26 million from $173.65 million, while Special Transactions went down by 18.3 percent to $64.0 million from $78.37 million.
Fig. 3. Philippine Imports by Major Type of Goods in January: 2001 & 2002
(F.O.B. Value in Million US Dollar)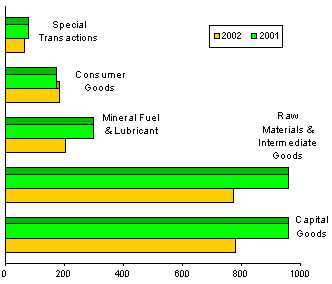
JAPAN CORNERS 18.3 PERCENT OF JANUARY IMPORT BILL
Purchases of Japanese made goods, comprising 18.3 percent of the total import bill, posted a reduction of 26.6 percent to $368.01 million from $501.20 million a year earlier. Exports to Japan, on the other hand amounted to $399.15 million yielding a two-way trade figure of $767.16 million and a trade surplus for RP placed at $31.14 million.
US, the country's second biggest source of imports with an 18.0 percent share, reported shipments valued at $362.16 million against exports amounting to $650.44 million. Total trade reached $1.013 billion while trade surplus for the Philippines stood at $288.27 million.
Republic of Korea followed as RP's third biggest source of imports. With payments worth $167.84 million, imports from Korea went up by 7.3 percent from $156.47 million as revenue from RP's exports reached only $97.50 million resulting to a total trade value of $265.34 million and a $70.34 million deficit for RP.
Other major sources of imports for the month were: Singapore, $140.07 million; Hongkong, $101.30 million; Taiwan, $87.51 million; People's Republic of China, $80.43 million; Saudi Arabia, $54.75 million; Germany, $53.81 million; and Thailand, $53.73 million.
Payments for imports from the top ten sources for the month amounted to $1.470 billion or 73.1 percent of the total.
Fig. 4. Philippine Imports by Country in January 2002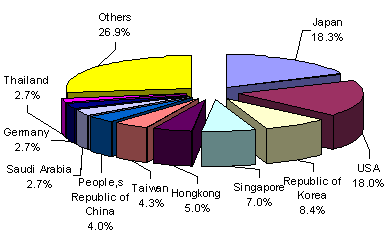
UNCOLLECTED DOCUMENTS
As of press time 79 out of 54,601 export documents and 114 out of 46,581 import documents are still expected from the ports.
Source: National Statistics Office
Manila, Philippines
