Results from the April 2014 Labor Force Survey (LFS)
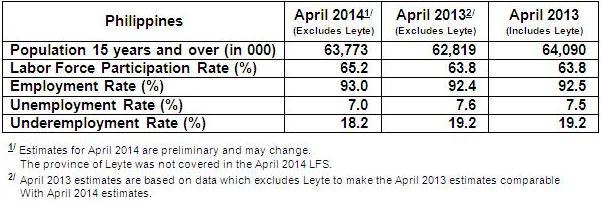
The employment rate in April 2014 is estimated at 93.0 percent. This estimate is based on the April 2014 round of the LFS which did not cover the province of Leyte. The employment rate for the same month of 2013, computed using data from the April 2013 LFS that includes the province of Leyte, was 92.5 percent. Using data from the same LFS round, but excluding data from the province of Leyte, the employment rate for April 2013 is estimated at 92.4 percent. For this report, the April 2013 labor and employment indicators, computed based on data which excludes the province of Leyte, are used when comparing the April 2014 estimates with the April 2013 figures.
Four regions, namely, National Capital Region (NCR) (89.6%), Ilocos Region (90.8%), CALABARZON (91.0%), and Central Luzon (91.4%) had employment rates lower than the national figure. The labor force participation rate (LFPR) in April 2014 is estimated at 65.2 percent, up from the LFPR in April 2013 which was estimated at 63.8 percent. The labor force consists of the employed and the unemployed.
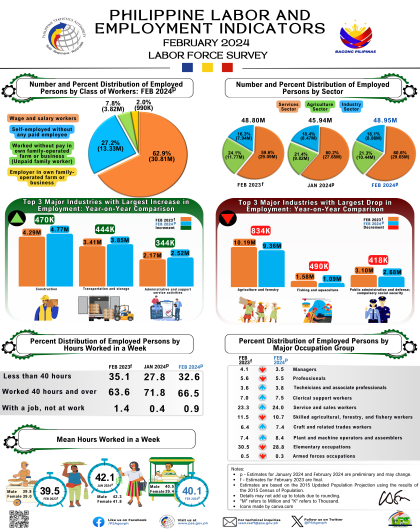
Workers are grouped into three broad sectors, namely, agriculture, industry and services sector. Workers in the services sector continued to comprise the largest proportion of the population who are employed. These workers made up 52.8 percent of the total employed in April 2014 (Table 1). Among them, those engaged in wholesale and retail trade or in the repair of motor vehicles and motorcycles accounted for the largest percentage (35.7% of workers in services sector) (Table 2). In April 2013, workers in the services sector accounted for 52.7 percent of the total employed, with those engaged in wholesale and retail trade or in the repair of motor vehicles and motorcycles making up the largest proportion (34.4% of workers in services sector) (Table 1 and 2).
Workers in the agriculture sector comprised the second largest group making up 30.7 percent of the total employed in April 2014, while workers in the industry sector made up the smallest group registering 16.4 percent of the total employed. Similar percentages were recorded for April 2013, with workers in agriculture making up at 31.2 percent of the total employed, and workers in industry sector, 16.2 percent. In the industry sector, workers in the manufacturing subsector made up the largest group, accounting for 52.4 percent of workers in this sector, and those in construction, the second largest group, making up 40.7 percent (Table 1 and 2).
Among the occupation groups, the laborers and unskilled workers remained the largest group making up 32.3 percent of the total employed in April 2014 (Table 1). In April 2013, such workers made up 32.5 percent of the total employed in that period. Officials of the Government and special interest organizations, corporate executives, managers, and managing proprietors (16.0% of the total employed) comprised the second largest occupation group, followed by farmers, forestry workers and fishermen (13.3%), and service workers and shop/market sales workers (12.5%).
Employed persons fall into any of these classes of workers: wage and salary workers, self-employed workers without any paid employee, employers in own family-operated farm or business, and unpaid family workers. Wage and salary workers are those who work for private households, private establishments, government or government-controlled corporations, and those who work with pay in own family-operated farm or business. In April 2014, the wage and salary workers made up 57.5 percent of the total employed, with those working in private establishments continuing to account for the largest percentage (Table 1). They made up 44.7 percent of the total employed in April 2014 and 44.4 percent of the total employed in April 2013. The second largest class of workers were the self-employed making up 28.2 percent of the total employed in April 2014, and 28.6 percent in April 2013. The third largest class of workers consisted of the unpaid family workers, accounting for 11.2 percent of the total employed in April 2014, and 10.9 percent of the total employed in April 2013.
Employed persons are classified as either full-time workers or part-time workers. Full-time workers are those who work for 40 hours or more in a week, while part-time workers work for less than 40 hours. Of the total employed persons in April 2014, 59.3 percent were full-time workers, while 38.7 percent were part-time workers (Table 3). By comparison, in April 2013, full-time workers comprised 63.8 percent while part-time workers, 34.5 percent. The proportion of full-time workers had decreased in all industry sectors. The decrease is most notable in the agriculture sector. In April 2014, workers worked 40.3 hours per week, on average, compared to 41.9 hours in April 2013. The mean hours worked per week had decreased in all sectors.
Employed persons who express the desire to have additional hours of work in their present job, or to have additional job, or to have a new job with longer working hours are considered underemployed. In April 2014, the underemployment rate, which is the percentage of the underemployed to the total employed, is estimated at 18.2 percent, while it was estimated at 19.2 percent in April 2013.
Underemployed persons who work for less than 40 hours in a week are called visibly underemployed persons. They accounted for 61.0 percent of the total underemployed in April 2014 (Table 4). The proportion in the same month of 2013 was lower (53.7%). By comparison, the underemployed persons who worked for 40 hours or more in a week made up 36.4 percent. By sector, 41.3 percent of the underemployed worked in the agriculture sector, while 40.9 percent were in the services sector. Those in the industry sector accounted for 17.8 percent (Table 4).
The unemployment rate in April 2014 is estimated at 7.0 percent. It is estimated at 7.6 percent for April 2013 based on the April 2013 LFS data which excludes Leyte. Including Leyte, the April 2013 unemployment rate is estimated at 7.5 percent. Among the regions, the NCR (10.4%), Ilocos Region (9.2%), Central Luzon (8.6%) and CALABARZON (9.0%) had unemployment rates higher than the national figure (Table 5).
Among the unemployed persons in April 2014, 61.7 percent were males. Of the total unemployed, the age group 15 to 24 years comprised 49.8 percent, while the age group 25 to 34, 30.5 percent. By educational attainment, one-fifth (22.4%) of the unemployed were college graduates, 14.5 percent were college undergraduates, and 32.7 percent were high school graduates (Table 6).
(Sgd.) LISA GRACE S. BERSALES, Ph.D.
National Statistician
Technical Notes
Starting July 2003, the Labor Force Survey (LFS) adopted the 2003 Master Sample Design, with a sample size of approximately 50,000 households.
Starting January 2012 LFS, the codes for industry adopted the 2009 Philippine Standard Industrial Classification (PSIC). Prior to this, codes for industry used the 1994 PSIC.
- Question on vocational course was introduced in the January 2012 LFS questionnaire.
Starting April 2005, the new unemployment definition was adopted per NSCB Resolution Number 15 dated October 20, 2004. As indicated in the said resolution, the unemployed include all persons who are 15 years and over as of their last birthday and are reported as: (1) without work and currently available for work and seeking work; or (2) without work and currently available for work but not seeking work for the following reasons:
- Tired/believed no work available
- Awaiting results of previous job application
- Temporary illness/disability
- Bad weather
- Waiting for rehire/job recall
Starting with the July 2007 LFS round, the population projections based on the 2000 Census of Population and Housing (CPH) was adopted to generate the labor force statistics. The 2000 CPH-based population projections has been endorsed as the official figures to be utilized for planning and programming purposes per NSCB Resolution No. 7 Series of 2006, entitled “Adopting the Methodology Used in Generating the 2000 Census of Population and Housing-Based National Regional and Provincial Population Projections”.
Overseas Filipino Workers are not considered part of the labor force in the Philippines. Hence, in the LFS, data on economic characteristics of household members who are overseas workers are not collected. For the LFS reports, they are excluded in the estimation of the size of working population, that is, population aged 15 years and older, and in the estimation of the labor force.
The province of Leyte was not covered in the April 2014 LFS. A new sampling frame for the province of Leyte has to be created. This is because of the large number of households in Leyte which were displaced by typhoon Yolanda. The old listing of households for Leyte used as sampling frame for the 2003 Master Sample is no longer usable.