
Total number of manufacturing establishments reaches 25,149 in 2013, top ten industries comprise more than half of the total number
The total number of manufacturing establishments in the formal sector of the economy in 2013 reached 25,149, according to the final results of the 2013 Annual Survey of Philippine Business and Industry (ASPBI).
Industrywise, the top ten manufacturing industries comprised more than half (57.2%) of all manufacturing establishments in the country. Bread, cakes, pastries, pies and similar 'perishable' bakery products accounted for 6,618 establishments or 26.3 percent of the total. Bottled water ranked second with 2,411 establishments or 9.6 percent. Printing came in third with 1,458 establishments (5.8%).
Other industries in the top ten are the following:
- Rice/corn milling (1,181 establishments or 4.7%)
- Wood Furniture (739 establishments or 2.9%)
- Structural concrete products (477 establishments or 1.9%)
- Women's and girls' and babies' garment (424 establishments or 1.7%)
- Custom tailoring (416 establishments or 1.7%)
- Men's and boys' garment (342 establishments or 1.4%)
- Plastic articles for packing goods (324 establishments or 1.3%)
Figure 1 presents the percent distribution of all manufacturing establishments by industry sub-class in 2013.

Semi-conductor devices and other electronic components industry leads in terms of employment generation
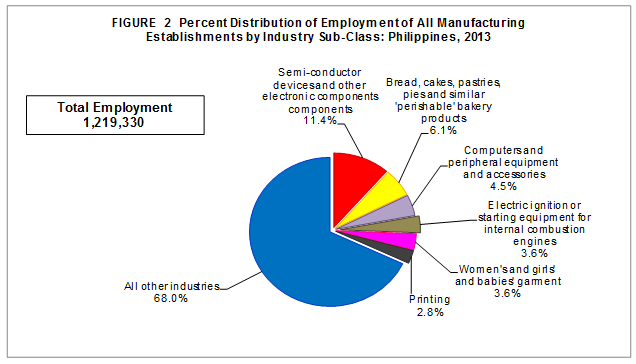
In 2013, all manufacturing establishments generated a total employment of 1,219,330. Paid employees made up 98.8 percent of total employment while the rest were working owners and unpaid workers.
Among industry sub-classes, the top ten industries in terms of employment generation accounted for a total of 482,953 workers with a combined share of 39.6 percent of the total workforce. Semi-conductor devices and other electronic components led the industries with 138,746 workers. Bread, cakes, pastries, pies and similar ‘perishable' bakery products with the most number of establishments ranked second with 74,406 workers. Computers and peripheral equipment and accessories ranked third with 55,288 workers.
Other industries comprising the top ten in terms of employment generation are:
- Electric ignition or starting equipment for internal combustion engines (44,259)
- Women's and girls' and babies' garment (43,333 workers)
- Printing (34,693 workers)
- Wearing apparel, n.e.c. (27,630 workers)
- Men's and boys' garment (21,645 workers)
- Parts and accessories for motor vehicles and their engines (21,621 workers)
- Plastic articles for packing goods (21,332 workers)
Figure 2 shows the percent distribution of employment of all manufacturing establishments by industry sub-class in 2013.
Manufacturing establishments spends PHP307.6 billion for total compensation of employees
Total compensation paid to employees by all manufacturing establishments was estimated at PHP307.6 billion in 2013. This translates to an average annual compensation of PHP255,368 per employee. The average annual compensation paid by 102 industry sub-classes or group of sub-classes surpassed the national average.
At the industry sub-class level, refined petroleum products paid the highest average annual compensation of PHP2.0 million per employee. Powdered milk and condensed or evaporated milk followed closely with PHP1.9 million per employee.
The following table shows the industries that paid an average annual compensation per employee of more than PHP1.0 million in 2013.

Semi-conductor and other electronic components industry generates the highest value of output
In 2013, value of output generated by all manufacturing establishments amounted to PHP4.3 trillion.
Among the industry sub-classes, the combined output value of the top ten industries accounted for PHP1.9 trillion or a combined share of 43.9 percent of the total. Semi-conductor devices and other electronic components contributed the biggest output of PHP538.8 billion or 12.4 percent of the total, followed by refined petroleum products with PHP476.3 billion or 11.0 percent.
Completing the list of the top ten contributors to PHP1.9 trillion worth of output are the following:
- Computers and peripheral equipment and accessories (PHP206.2 billion, 4.8%)
- Powdered milk and condensed or evaporated milk (PHP125.6 billion, 2.9%)
- Cigarettes and cigars (PHP115.1 billion, 2.7%)
- Motor vehicles (PHP108.5 billion, 2.5%)
- Cement (PHP88.5 billion, 2.0%)
- Parts and accessories for motor vehicles and their engines (PHP86.7 billion, 2.0%)
- Non-ferrous smelting and refining, except precious metals (PHP80.3 billion, 1.9%)
- Prepared animal feeds (PHP78.1 billion, 1.8%)
Figure 3 shows the top ten industries that generated the highest value of output for all manufacturing establishments in 2013.

Total expense amounts to PHP4.0 trillion
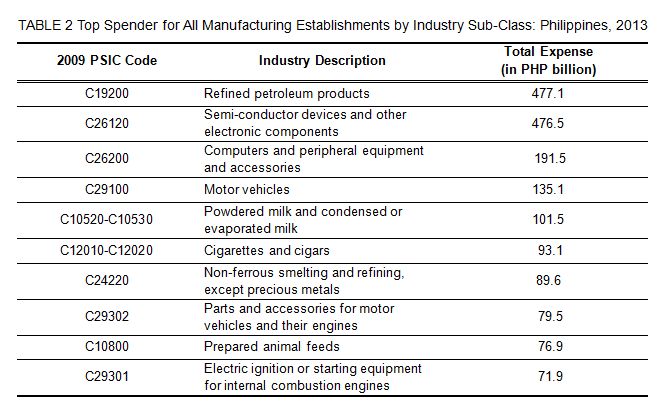
Total expense, including compensation, incurred in business operations by all manufacturing establishments amounted to PHP4.0 trillion in 2013. Of the total expense, PHP307.6 billion or 7.6 percent of the total was spent for compensation of employees.
At the industry sub-class, the combined expense of the top ten industries was estimated at PHP1.8 trillion or 44.6 percent of the total. Refined petroleum products spent the biggest amounting to PHP477.1 billion. Semi-conductor devices and other electronic components followed closely with PHP476.5 billion.
The list of the top ten industries in terms of expense is shown in Table 2.
Semi-conductor and other electronic components industry also leads in terms of value added
In 2013, value added generated by all manufacturing establishments was estimated at PHP1.0 trillion.
Across industry sub-classes, the combined share of the top ten industries accounted for 48.4 percent (PHP501.9 billion) of the total value added of all manufacturing establishments. Semi-conductor devices and other electronic components led the top contributors to value added with PHP149.5 billion (14.4%). A far second was cigarettes and cigars with a total contribution of PHP78.1 billion or 7.5 percent of the total. Malt liquors and malt ranked third with PHP49.4 billion or 4.8 percent of the total value added.
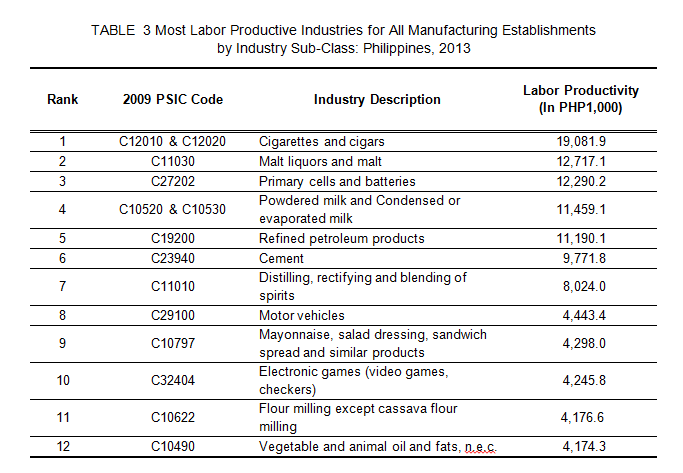
The ratio of value added to total employment, a measure of labor productivity, was posted at PHP850.4 thousand. The highest labor productivity among industry sub-classes was recorded in cigarettes and cigars, valued at PHP19,081.9 thousand per worker.
Table 3 presents the manufacturing industries with more than PHP4.0 million worth of labor productivity in 2013.
Gross addition to tangible fixed assets reaches PHP102.9 billion
In 2013, gross addition to tangible fixed assets of all manufacturing establishments reached PHP102.9 billion.
Among the industry sub-classes, 14 industries with more than PHP2.0 billion each of contribution to total gross addition to tangible fixed assets accounted for PHP57.7 billion or 56.1 percent of the total. Semi-conductor devices and other electronic components contributed the highest gross addition to tangible fixed assets at PH16.5 billion or 16.0 percent of the total. This was followed by cement with PHP7.1 billion (6.9%) and non-ferrous smelting and refining, except precious metals with PHP4.9 billion (4.8%).
Total subsidies received amounts to PHP912.2 million
Subsidies are special grants in the form of financial assistance or tax exemption or tax privilege provided by the government to aid and develop an industry. In 2013, subsidies received by all manufacturing establishments amounted to PHP912.2 million.
Among the industry sub-classes that received subsidies in 2013, the top three industries received a combined share of more than three-fourths (78.6%) of the total. Parts and accessories for motor vehicles and their engines received the highest subsidies amounting to PHP387.1 million or 42.4 percent of the total. Printing and finishing of textiles placed second and third, with PHP184.0 million (20.2%) and PHP145.8 million (16.0%), respectively.
Sales from e-commerce accounts for merely 0.2 percent of the total income
E-commerce sales generated by all manufacturing establishments amounted to PHP7.1 billion, accounting for merely 0.2 percent of total income in 2013.
By industry sub-class level, optical instruments and lenses recorded the highest sales through e-commerce at PHP3.0 billion or 20.5 percent of the total income of the industry. Semi-conductor devices and other electronic components followed generating PHP1.5 billion or only 0.3 percent of the total income.
TECHNICAL NOTES
Introduction
This Special Release presents the final results of the 2013 ASPBI for all manufacturing establishments.
The 2013 ASPBI is a forerunner of the 2010 ASPBI and one of the designated statistical activities of the Philippine Statistics Authority (PSA). Data collected from the survey provide information on the levels, structure, performance and trends of economic activities of the formal sector in the entire country. The 2013 Survey on Information and Communication Technology (SICT) was undertaken as a rider to this survey. The field operation of the 2013 ASPBI also integrated the data collection in updating the 2014 List of Establishments (ULE).
The survey was conducted nationwide in September 2014 with the year 2013 as the reference period, except for employment which is as of November 15, 2013.
Beginning with the 2013 ASPBI, the data processing was done on a decentralized set-up particularly by the provincial offices. The set-up is in line with the PSA’s strategic direction to decentralize the data processing of surveys to the field offices. A new strategy in data processing was implemented through the use of an online system called the Establishment Data Management System.
Data are presented at the national and industry sub-class or 5-digit 2009 Philippine Standard Industrial Classification (PSIC).
Legal Authority
The conduct of 2013 ASPBI is authorized under the following:
Republic Act 10625 known as the Philippine Statistical Act of 2013 dated September 12, 2013 - (Reorganizing and strengthening of the Philippine Statistical System (PSS), its agencies and instrumentalities). It shall be the policy of the State to effect the necessary and proper changes in the organizational and functional structures of the PSS in order to rationalize and promote efficiency and effectiveness in the delivery of statistical services.
Section 27 of Republic Act No. 10625 states that:
“…Respondents of primary data collection activities such as censuses and sample surveys are obliged to give truthful and complete answers to statistical inquiries. The gathering, consolidation and analysis of such data shall likewise be done in the most truthful and credible manner. Any violation of this Act shall result in the imposition of the penalty of one (1) year imprisonment and a fine of One hundred thousand pesos (P100,000.00). In cases where the respondent fails to give truthful and complete answers to such statistical inquiries is a corporation, the above penalty shall be imposed against the responsible officer, director, manager and/or agent of said corporation. In addition, such erring corporation, enterprise or business concerned, shall be imposed a fine ranging from One hundred thousand pesos (P100,000.00) to Five hundred thousand pesos (P500,000.00)...”
Scope and Coverage
The 2013 ASPBI covered establishments engaged in 18 economic sectors classified under the 2009 PSIC, namely:
- Agriculture, Forestry and Fishing (A)
- Mining and Quarrying (B)
- Manufacturing (C)
- Electricity, Gas, Steam, and Air Conditioning Supply (D)
- Water Supply; Sewerage, Waste Management and Remediation Activities (E)
- Construction (F)
- Wholesale and Retail Trade; Repair of Motor Vehicles and Motorcycles (G)
- Transportation and Storage (H)
- Accommodation and Food Service Activities (I)
- Information and Communication (J)
- Financial and Insurance Activities (K)
- Real Estate Activities (L)
- Professional, Scientific and Technical Activities (M)
- Administrative and Support Service Activities (N)
- Education (P)
- Human Health and Social Activities (Q)
- Arts, Entertainment and Recreation (R)
- Other Service Activities (S)
The survey was confined to the formal sector of the economy, which consists of the following:
- Corporations and partnership
- Cooperatives and foundations
- Single proprietorship with employment of 10 and over
- Single proprietorships with branches
Hence, the 2013 ASPBI covered only the following economic units:
- All establishments with total employment (TE) of 10 and over, and
- All establishments with TE of less than 10, except those establishments with Legal Organization = 1 (single proprietorship) and Economic Organization = 1 (single establishment), that are engaged in economic activities classified according to the 2009 PSIC.
Frame
The frame for the 2013 ASPBI was extracted from the 2013 List of Establishments (LE). The 2013 LE is the combined result of the following:
1. 2012 Updating of the List of Establishments (ULE) conducted during the period from May to July 2012
2. Survey feedbacks from the 2013 Quarterly Survey of Philippine Business and Industry (QSPBI) and 2013 Monthly Integrated Survey of Selected Industries (MISSI); the 2012 Census of Philippine Business and Industry (CPBI); list of branches and subsidiaries from the 2011 Survey of enterprises in the Philippines (SEP); and additional establishments from Albay and Davao Oriental with submitted Establishment Inquiry Forms (ULE Form3) also provided updates on characteristics and status of sample establishments
3. Lists from 2012 and 2013 Labor Turnover Survey of the Bureau of Labor and Employment Statistics
The estimated number of establishments in the 2013 LE totaled 941,000 establishments in operation in 2013. Of this, about 28.0 percent or 263,000 establishments belong to the formal sector of which 87.0 percent or 229,000 establishments comprised the establishment frame. This frame was used to draw the sample establishments for the survey.
Unit of Enumeration
Like all other establishments censuses/surveys conducted by the PSA, the 2013 ASPBI unit of enumeration is the establishment. The establishment is defined as an economic unit under a single ownership or control which engages in one or predominantly one kind of activity at a single fixed location.
For manufacturing, the unit of enumeration consists of shop, factory, bakery, mill, distillery, refinery, cannery, abattoir, brewery, foundry, printing press, tannery or plant engaged in manufacturing, processing, fabricating or finishing products mechanically or manually including the assembly of component parts of manufactured products and the substantial alteration, reconstruction or repair of special type of goods and classified under economic organization such as: single establishment (EO=1), branch only (EO=2) and establishment and main office (EO=3).
Classification of Establishments
An establishment is categorized by its economic organization, legal organization, industrial classification, employment size, and geographic location.
Economic Organization relates to the organizational structure or role of the establishment in the organization. An establishment may be single establishment, branch, establishment and main office with branches elsewhere, main office only, and ancillary unit other than main office.
Legal Organization refers to the legal form of the economic entity that owns the establishment. This provides the legal basis for ownership. An establishment may be single proprietorship, partnership, government corporation, stock corporation, non-stock corporation, and cooperative.
Industrial classification of an economic unit was determined by the activity from which it derives its major income or revenue. The 2009 PSIC was utilized to classify economic units according to their economic activities.
Size of an establishment is determined by its total employment (TE) as of a specific date.
Geographic Classification refers to classification of establishments by geographic area using the Philippine Standard Geographic Code (PSGC) classification.
Methodology
Sampling Design
The 2013 ASPBI utilized stratified systematic sampling with 5-digit PSIC serving as the industry strata and employment size as the second stratification variable.
For establishments with TE of 20 and over, the 17 administrative regions serve as the geographic domains while the 5-digit level (sub-class) of the 2009 PSIC serves as the industry domain. For the manufacturing sector, 419 industry sub-classes serve as the industry domain.
Estimation Procedure
For Establishment with TE of less than 20
- Non-Certainty Stratum
The estimate of the total of a characteristic  for the non-certainty employment stratum TE less than 20 in the sth industry domain is
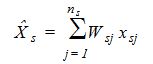
where:
s denotes the non-certainty employment strata in employment of less than 20
xsj = value of the jth establishment in the non-certainty employment stratum in employment of less than 20 in the sth industry domain
j = 1, 2, 3,…, nsp establishments
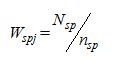
Wsj = weight of the jth establishment in the non-certainty employment stratum in employment of less than 20 in the sth
industry domain
industry domain
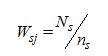
Ns = total number of establishments in the non-certainty employment strata in TE of 20 and over for an industry domain in each region
nsp = number of sample establishments in the non-certainty employment strata in TE of 20 and over for an industry domain in each region
b. Certainty Stratum
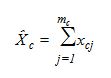
The estimate of the total of a characteristic  for the certainty employment stratum in the cth industry domain is
where:
c denotes the certainty employment strata in employment of less than 20 in the cth industry domain
xcj = value of the jth establishment in the certainty employment strata in employment of less than 20 in the cth industry domain
j = 1, 2, 3, …, mc establishments
mc = number of establishments in the certainty employment strata in employment of less than 20 in the cth industry domain
Total Estimate for TE of Less Than 20
National level estimates of the total of a characteristic (Xd) for the industry domain was obtained by aggregating the estimates for all employment strata (non-certainty and certainty) in the same industry domain,
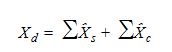
where d denotes the industry domain
For Establishments with TE of 20 and Over
- Non-Certainty Stratum (TE of 20-49 and 50-99)
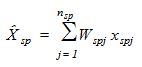
The estimate of the total of a characteristic  for the non-certainty employment stratum in TE of 20 and over for an industry domain in each region (geographic domain) is
where:
s denotes the non-certainty employment stratum in TE of 20 and over
p = 1, 2,..., 17 regions (geographic domains)
xspj = value of the jth establishment in the non-certainty employment stratum in TE of 20 and over for an industry domain in each region
j = 1, 2, 3,…, nsp establishments
Wspj = weight of the jth establishment in the non-certainty employment stratum in TE of 20 and over for an industry domain in each region
Nsp = total number of establishments in the non-certainty employment stratum in TE of 20 and over for an industry domain in each region
nsp = number of sample establishments in the non-certainty employment stratum in TE of 20 and over for an industry domain in each region
- Certainty Stratum
The estimate of the total of a characteristic  for the certainty employment stratum in TE of 20 and over in an industry domain in each geographic domain (region) is

where:
c denotes the certainty employment stratum in TE of 20 and over
p = 1, 2,..., 17 regions (geographic domains)
xcpj = value of the jth establishment in the certainty employment stratum in TE of 20 and over in an industry domain within each region
j = 1, 2, 3, …, mcp establishments
mcp = number of establishments in the certainty employment stratum in TE of 20 and over in an industry domain within each region
Total Estimate for TE of 20 and Over
The estimate of the total of a characteristic  for the industry domain in each region (geographic domain) was obtained by aggregating the estimates for all employment strata (non-certainty and certainty) in the same industry domain,

where dp denotes the industry domains in each region
National level estimates of the characteristics by industry domain were obtained by aggregating separately the estimates for the particular industry domain from all the regions.
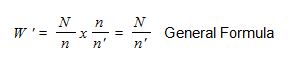
Weight Adjustment Factor for Non-Response
To account for non-response in the non-certainty strata, the adjustment factors, and (n/n’) was multiplied with the sampling weight (W) of each of the sampling unit. The sampling weight which is defined as N/n was recomputed as
Thus, the adjusted weight (W’sj) for employment stratum in TE of 1-9 and 10-19 is

where:
Ns = total number of establishments in the employment stratum in TE of 1-9 and 10-19 in the sth industry domain
n’s = number of responding establishments in the employment stratum in TE of 1-9 and 10-19 in the sth industry domain
For the non-certainty employment stratum in TE of 20-49 and 50-99, the adjusted weight (W’spj) is
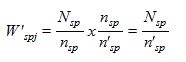
where:
Nsp = total number of establishments in the non-certainty employment stratum in TE of 20-49 and 50-99 for an industry domain within each geographic domain (region)
n’sp = number of responding establishments in the non-certainty employment stratum in TE of 20-49 and 50-99 for an industry domain within each geographic domain (region)
Questionnaire Design
The questionnaire design is basically the same as that of the 2012 Census of Philippine Business and Industry. However, changes were made in the disaggregation of data items for fixed assets in support to the requirements of the 2008 Systems of National Accounts with respect to the generation of fixed capital formation.
The sample establishments responded also to the survey through the use of Web-based version of the 2013 ASPBI questionnaires which was accomplished online at the PSA website.
Response Rate
The response rate for all manufacturing establishments was 90.0 percent (6,071 out of 6,747 establishments). Included are receipts of "good" questionnaires, partially accomplished questionnaires, reports of closed, moved out or out of scope establishments, etc.
Reports of the remaining non-reporting establishments were imputed based on established imputation methods and from other available administrative data sources. However, reports of establishments in the certainty stratum, which were found to be duplicates and out of business in 2013, were not imputed.
Concepts and Definitions of Terms
Establishment is an economic unit under a single ownership control, i.e., under a single entity, engaged in one or predominantly one kind of economic activity at a single fixed location.
Total employment is the number of persons who worked in for the establishment as of November 15, 2013.
Paid employees are all full-time and part-time employees working in or for the establishment and receiving pay, as well as those working away from the establishment and paid by and under the control of the establishment. Included also are all employees on sick or maternity leave, paid vacation or holiday and on strike. Excluded are directors paid solely for their attendance at meetings, consultants, workers on indefinite leave, working owners who do not receive regular pay, homeworkers and workers receiving pure commissions only.
Unpaid workers are working owners who do not receive regular pay, apprentices and learners without regular pay, and persons working for at least 1/3 of the working time normal to the establishment without regular pay. Excluded are silent or inactive business partners.
Compensation is the sum of salaries and wages, separation, terminal pay and gratuities paid by the establishment to its employees and total employer’s contribution to SSS/GSIS, ECC, PhilHealth, PAG-IBIG etc.
Income or Revenue includes cash received and receivables for goods/products and by-products sold and services rendered.
Expense refers to cost incurred in an enterrise' s efforts to generate revenue, representing the cost of doing business. Excludes cost incurred in aquisition of income generating assets.
Value of output represents the sum of the sale of products and by-products, income from industrial services done for others, sale of goods less cost of goods sold, fixed assets produced on own account, and change in inventories of finished products and work-in-progress.
Intermediate expense refers to expenses incurred in the production of goods and industrial services such as raw materials used; other materials and supplies used; fuels, lubricants, oils and greases used; electricity and water purchased and industrial services done by others.
Value added is gross output less intermediate input. Gross output for the manufacturing sector is value of output plus income from non-industrial services done for others (except rent income from land). Intermediate input is intermediate expense plus expense for non-industrial services done by others (except rent expense for land) and all other cost.
Gross addition to tangible fixed assets is equal to capital expenditures less sale of fixed assets, including land.
Change in total inventories is computed as the total value of ending inventory less the total beginning inventory.
Subsidies are all special grants in the form of financial assistance or tax exemption or tax privilege given by the government to aid and develop an industry.
E-Commerce refers to the selling of products or services over electronic systems such as the Internet Protocol-based networks and other computer networks, Electronic Data Interchange (EDI) network, or other on-line system.
Source: Industry Statistics Division
Economic Sector Statistics Service
Sectoral Statistics Office
Tel. No. 376-2060