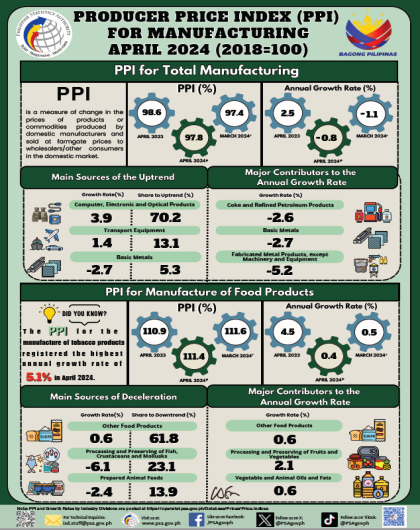
Producer Price Index for Manufacturing (2018=100) April 2024
Year-on-Year
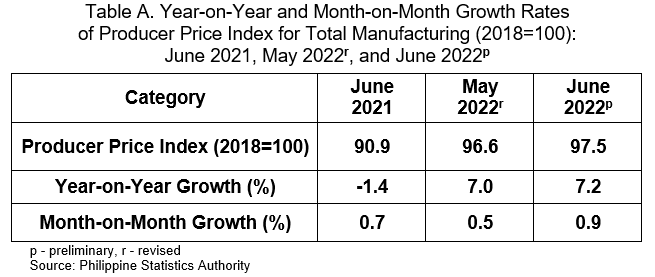
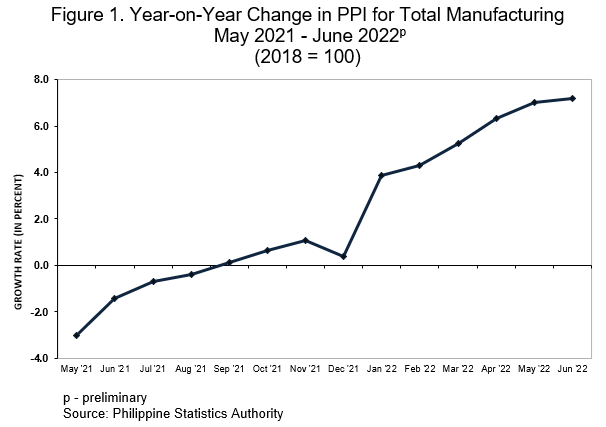
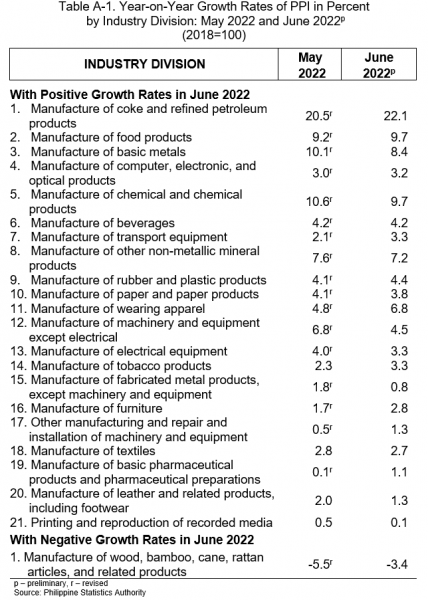
The Producer Price Index (PPI) for manufacturing posted a faster annual rate of 7.2 percent in June 2022, compared with the upturn of 7.0 percent in May 2022. In June 2021, the PPI dropped at an annual rate of -1.4 percent. (Table A)
The year-on-year increase in the PPI in June 2022 can be attributed to the annual expansions in the indices of 21 industry divisions led by manufacture of coke and refined petroleum products which registered an annual growth of 22.1 percent.
On the other hand, only the manufacture of wood, bamboo, cane, rattan articles and related products exhibited downturn in its annual growth rate of -3.4 percent. (Tables A-1 and 1)
Month-on-Month
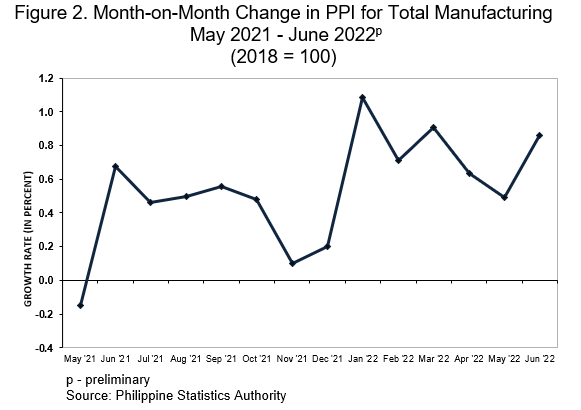
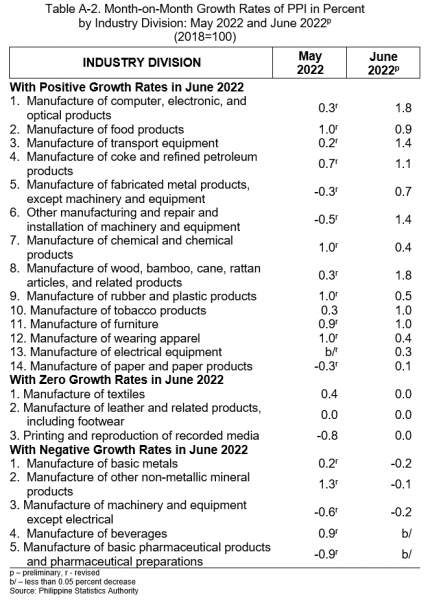
Month-on-month, the PPI for manufacturing posted a faster increment with monthly growth rate of 0.9 percent in June 2022 compared with the 0.5 percent increase in May 2022. In June 2021, the PPI likewise recorded a monthly increase of 0.7 percent. (Table A)
Fourteen (14) industry divisions registered positive monthly growth rates in June 2022 led by manufacture of computer, electronic and optical products; and manufacture of wood, bamboo, cane, rattan articles and related products, both posting a monthly increment of 1.8 percent.
On the contrary, the PPI of five industry divisions exhibited monthly downturns with manufacture of machinery and equipment except electrical and manufacture of basic metals, both posting the highest monthly drop of -0.2 percent. Moreover, the monthly growth rate of three industry divisions were at 0.0 percent. (Tables A-2 and 1)
DENNIS S. MAPA, Ph.D.
Undersecretary
National Statistician and Civil Registrar General
Technical Notes
- Introduction
Starting with the January 2021 reference period, the Producer Price Index (PPI) for Manufacturing uses the 2018 as base year, from the previously used 2000 base period. The PPI for Manufacturing measures the changes in the producer price of key commodities produced by the Manufacturing sector. One of its uses is as a deflator to derive the Volume of Production Index (VoPI) and Volume of Net Sales Index (VoNSI).
The PPI for Manufacturing is generated from the results of the Producer Price Survey (PPS) which is conducted nationwide. The survey gathers monthly producer prices of selected products included in the market basket of PPI from sample establishments.
- Method of Index Computation
The PPI utilizes the chained Paasche-type method of index computation where the base year is normalized. The weights are computed from the value of production from the Census of Philippine Business and Industry (CPBI) or Annual Survey of Philippine Business and Industry (ASPBI), whichever is the more recent. The weights are updated as soon as new results of the CPBI or ASPBI are available and these are applied at the beginning of each survey year.
For the 2022 PPI, the base year used is 2018 and the weights of the industry divisions and industry groups were computed based on the results of the 2019 ASPBI for Manufacturing establishments with total employment of 20 and over.
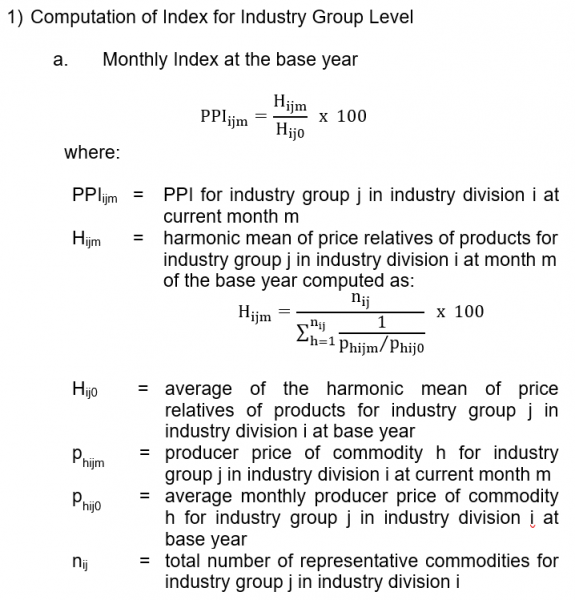
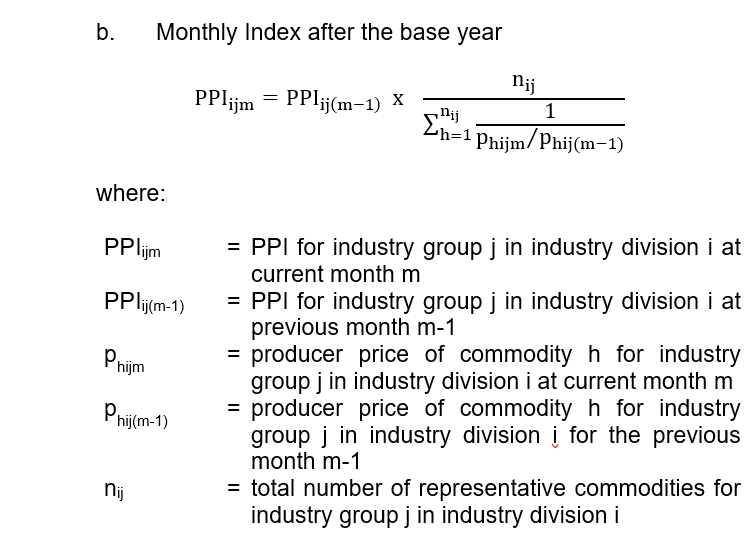
The computation of PPI adopts the following formula:
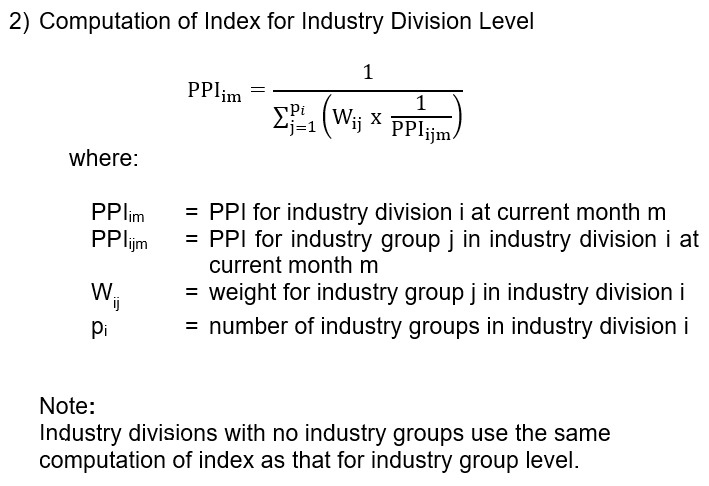
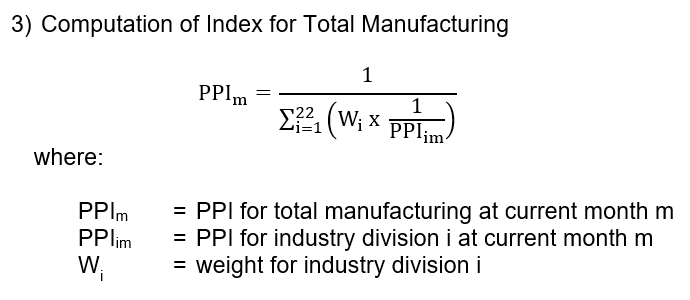
Note: A link factor has been used to adjust weight effects to measure the correct price change.
- Computation of Growth Rates
Year-on-year growth rates are computed by dividing the current month’s index by the index of the same month of the previous year less 1.
Month-on-month growth rates are computed by dividing the current month’s index by the previous month’s index less 1.
- Imputation and Revision
Imputation is done for sample establishments that are in operation during the reference period but with no received response during the release date. Results are revised accordingly when the actual data are received, and these revisions are reflected in the next release.
- Industry Coverage
Starting with the January 2013 reference month, PPI utilizes the 2009 Philippine Standard Industrial Classification (PSIC) to classify sectors and industries. Selected industry groups of the 2009 PSIC were grouped to form the 22 industry divisions of the 2021 PPS. These are presented in the table below.
|
2009 PSIC CODE |
INDUSTRY DESCRIPTION |
|---|---|
|
C10 |
Manufacture of food products * |
|
C11 |
Manufacture of beverages |
|
C12 |
Manufacture of tobacco products |
|
C13 |
Manufacture of Textiles |
|
C14 |
Manufacture of wearing apparel |
|
C15 |
Manufacture of leather and related products, including footwear |
|
C16 |
Manufacture of wood, bamboo, cane, rattan articles, and related products products* |
|
C17 |
Manufacture of paper and paper products |
|
C18 |
Printing and reproduction of recorded media |
|
C19 |
Manufacture of coke and refined petroleum products |
|
C20 |
Manufacture of chemical and chemical products* |
|
C21 |
Manufacture of basic pharmaceutical products and pharmaceutical preparations |
|
C22 |
Manufacture of rubber and plastic products* |
|
C23 |
Manufacture of other non-metallic mineral products* |
|
C24 |
Manufacture of basic metals* |
|
C25 |
Manufacture of fabricated metal products, except machinery and equipment* |
|
C26 |
Manufacture of computer, electronic, and optical products* |
|
C27 |
Manufacture of electrical equipment* |
|
C28 |
Manufacture of machinery and equipment except electrical* |
|
C29, C30 |
Manufacture of transport equipment* |
| C31 | Manufacture of furniture |
| C32, C33 | Other manufacturing |
* Industry divisions categorized further into industry groups
See more at the Producer Price Survey (PPS) main page.