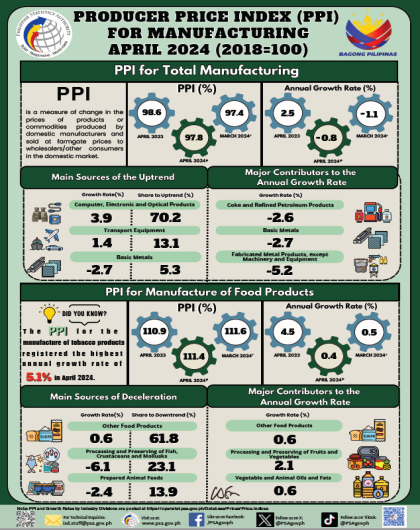
Producer Price Index for Manufacturing (2018=100) April 2024
|
Table A Year-on-Year and Month-on-Month Growth Rates of Producer Price Index: October 2015 and September 2015 |
||
|---|---|---|
|
TOTAL MANUFACTURING
|
October
2015
|
September
2015
|
|
Producer Price Index (2000=100) |
139.2 |
140.0 r |
|
Year-on-Year Growth |
-7.6 |
-8.1 r |
|
Month-on-Month Growth |
-0.6 |
0.6 |
r -revised
- Producer Price Index decelerates in October 2015
Producer Price Index (PPI, 2000=100) for manufacturing dropped by 7.6 percent in October 2015. During the same month last year, it declined by 0.7 percent. This can be attributed to the double-digit decrements of five major sectors namely: Furniture and fixtures (-34.1%), electrical machinery (-19.4%), petroleum products (-18.7%), wood and wood products (-17.9%) and basic metals (-10.4%). On the other hand, the remaining 11 sectors posted single-digit increases led by beverages (8.0%). Refer to Tables 1 and A-1.
On a month-on-month performance, the PPI likewise moved down by 0.6 percent. It posted a positive growth of 0.6 percent during the previous month. The negative performance of the monthly PPI can be traced to the decreases posted by thirteen out of the twenty major sectors including the heavily weighted sectors: electrical machinery (-1.6%) and petroleum products (-1.3%). Refer to Tables 1 and A-2.
TABLE A-1 Producer Price Index, September 2015 and October 2015:
(2000=100)
|
Gainers |
Year-on-Year Growth (percent) |
|
|---|---|---|
| October 2015 |
September 2015
(revised)
|
|
|
Beverages |
8.0 |
8.0 |
|
Machinery except Electrical |
3.4 |
1.8 |
|
Chemical Products |
2.4 |
1.4 |
|
Miscellaneous Manufactures |
4.9 |
5.6 |
|
Paper and Paper Products |
3.6 |
3.8 |
|
Food Manufacturing |
0.2 |
0.4 |
|
Fabricated Metal Products |
1.7 |
1.1 |
|
Tobacco Products |
0.9 |
0.9 |
|
Textiles |
1.5 |
1.6 |
|
Transport Equipment |
0.1 |
-1.8 |
|
Leather Products |
0.9 |
1.2 |
|
Losers |
Year-on-Year Growth (percent) |
|
|---|---|---|
| October 2015 |
September 2015
(revised)
|
|
|
Electrical Machinery |
-19.4 |
-17.3 |
|
Petroleum Products |
-18.7 |
-22.2 |
|
Basic Metals |
-10.4 |
-12.7 |
|
Non-Metallic Mineral Products |
-6.4 |
-6.5 |
|
Wood and Wood Products |
-17.9 |
-18.5 |
|
Rubber and Plastic Products |
-4.0 |
-3.4 |
|
Footwear and Wearing Apparel |
-2.4 |
-2.7 |
|
Furniture and Fixtures |
-34.1 |
-39.9 |
|
Printing |
-1.6 |
-1.6 |
TABLE A-2 Producer Price Index, September 2015 – October 2015:
(2000=100)
(2000=100)
|
Gainers |
Month-on-Month Growth (percent) |
|
|---|---|---|
| October 2015 |
September 2015
(revised)
|
|
|
Transport Equipment |
0.3 |
0.7 |
|
Basic Metals |
0.5 |
1.3 |
|
Fabricated Metal Products |
1.3 |
0.1 |
|
Wood and Wood Products |
0.6 |
-0.1 |
|
Rubber and Plastic Products |
0.1 |
-0.5 |
|
Tobacco |
0.0 |
0.0 |
|
Beverages |
0.0 |
0.0 |
|
Losers |
Month-on-Month Growth (percent) |
|
|---|---|---|
| October 2015 |
September 2015
(revised)
|
|
|
Electrical Machinery |
-1.6 |
3.1 |
|
Petroleum Products |
-1.3 |
3.1 |
|
Machinery except Electrical |
-0.8 |
0.3 |
|
Footwear and Wearing Apparel |
-2.1 |
0.2 |
|
Chemical Products |
-0.4 |
-0.4 |
|
Miscellaneous Manufactures |
-1.2 |
0.4 |
|
Food Manufacturing |
-0.1 |
0.0 |
|
Paper and Paper Products |
-0.2 |
-0.1 |
|
Furniture and Fixtures |
-0.5 |
-6.4 |
|
Non-Metallic Mineral Products |
b/ |
0.0 |
|
Leather Products |
-0.2 |
0.1 |
|
Printing |
b/ |
0.0 |
|
Textiles |
b/ |
0.0 |
Notes:
b/ - Less than 0.1 percent decrease
Sectors are ranked according to their contribution to the overall 2000-based growth rate
Year-on-year growth rates are computed by dividing the current month index by previous
year same month index less 1.
Month-on-month growth rates are computed by dividing the current
month index by previous month index less 1.
Technical Notes
- Introduction
The Philippine Statistics Authority generates various price indices, one of these is the Producer Price Index (PPI). The PPI, a designated statistics, is generated through the results of the Producer Price Survey (PPS) conducted nationwide. The survey gathers monthly producer prices of selected products of establishments included in the market basket.
The PPI is used as a deflator of the Monthly Integrated Survey of Selected Industries (MISSI) to derive indicators for the Volume of Production Index (VoPI) and Volume of Net Sales (VoNSI).
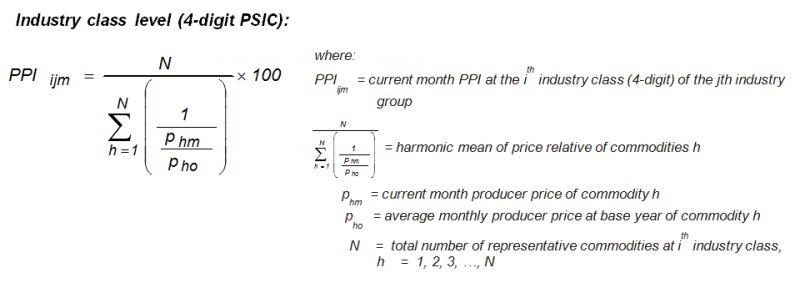
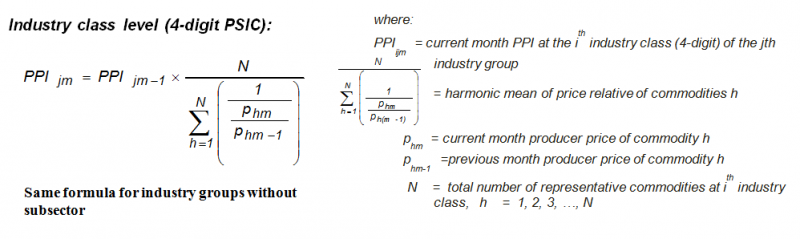
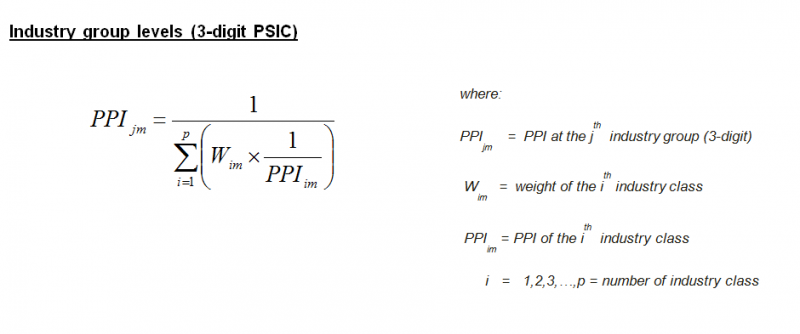
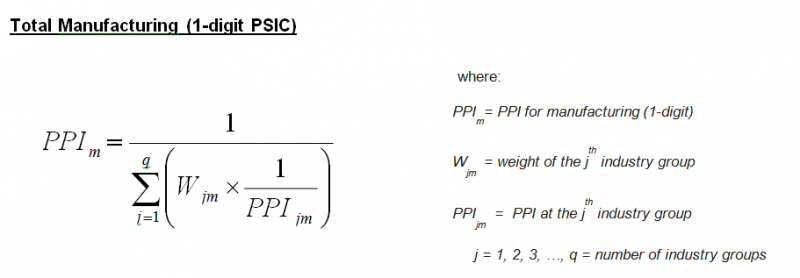
- Method of Index Computation
PPI utilizes the Paasche-type method of index computation. The weights are computed from the value of production to derive concentration ratios from the Census of Philippine Business and Industry (CPBI) or Annual Survey of Philippine Business and Industry (ASPBI). The weights are updated as soon as new results of the ASPBI or CPBI are available and applied at the beginning of each survey year.
For the 2015 PPI, the weights of the major sectors and sub-sectors were computed from the results of the 2012 CPBI for Manufacturing Establishments with total employment of 20 and over, which is the latest census results.
The formulas in the computation of the PPI are as follows:
- Industry Coverage
Starting with January 2013 reference month, the PPI utilizes the 2009 Philippine Standard Industry Classification (PSIC) to classify sectors and industries. Selected industry classes of the 2009 PSIC were grouped to form the 20 industry groupings of the 2014 PPS. These are presented in the table below.
|
2009 PSIC CODE |
INDUSTRY DESCRIPTION |
|---|---|
|
C10 |
Food manufacturing * |
|
C11 |
Beverages |
|
C12 |
Tobacco products |
|
C13 |
Textiles* |
|
C14,C152 |
Footwear and wearing apparel |
|
C151 |
Leather products |
|
C16 |
Wood and wood products* |
|
C17 |
Paper and paper products |
|
C18 |
Printing and reproduction of recorded media |
|
C19 |
Petroleum products* |
|
C20,C21 |
Chemical products* |
|
C22 |
Rubber and plastic products* |
|
C23 |
Non-metallic mineral products* |
|
C24 |
Basic Metals* |
|
C25 |
Fabricated metal products |
|
C262,C275,C28,C263,C268 |
Machinery except electrical* |
|
C261,C264,C27,C29301 |
Electrical machinery* |
|
C29 except C29301,C30 |
Transport equipment |
|
C31 |
Furniture and fixtures |
|
C265,C266,C267,C32 |
Miscellaneous manufactures |
Note: * - Major sectors categorized into sub-sectors
- Response Rate
The response rate for October 2015 is 79.1 percent, which corresponds to the retrieval of 576 establishments’ reports out of the 728 samples for the survey. Refer to Table B.
Response rates for wood and wood products and rubber and plastic products both reached 100 percent. Refer to Table 2.
|
Table B Response Rates For Total Manufacturing
(In Percent)
|
|
|---|---|
|
October 2015 |
September 2015
(revised)
|
|
79.1 |
91.3r |
Missing prices for products of sample establishments are estimated using the short-term geometric mean of the actual prices of responding samples within the same industry class. Revisions to the preliminary estimates are done upon receipt of actual reports from late responding establishments.
FOR THE NATIONAL STATISTICIAN:
(Sgd.) ROMEO S. RECIDE
(Interim Deputy National Statistician)
Officer-in-Charge