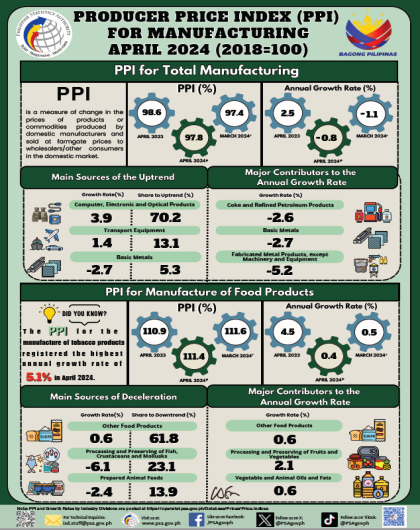
Producer Price Index for Manufacturing (2018=100) April 2024
Total Manufacturing | September 2006 | August 2006 |
| Producer Price Index | 251.2 | 251.5r |
| Year-on-Year Growth | 9.1 | 14.4r |
| Month-on-Month Growth | -0.1 | -0.8r |
r-revised
· Producer Price Index (PPI) on its single-digit growth
Producer Price Index (PPI) for the manufacturing industry on a yearly basis stepped up by 9.1 percent in September 2006. Monthly price increases were noted in seventeen (17) major sectors, with two-digit growth observed in the following: electrical machinery, footwear and wearing apparel, leather products, machinery excluding electrical and rubber products. Refer to Tables 1 and 1-A.
On a month-on-month basis, PPI however was slightly down by 0.1 percent in September 2006. This was brought about by the continued price decreases reported by petroleum products, contributing the highest decline of 4.8 percent. Refer to Tables 1 and 1-B.
· Response Rate
The response rate for September 2006 is 88.8 percent, which corresponds to the retrieval of 238 sample establishments� reports. Refer to Table 2.
Response Rates for Total Manufacturing
(In percent)
September 2006 | August 2006 |
88.8 | 98.5 |
· Technical Notes
Weights for the PPI are based from the results of the 2003 Annual Survey of Philippine Business and Industry (ASPBI) for manufacturing establishments with average total employment (ATE) of 20 and over.
Data of non-responding sample establishments are estimated based on previous records and other available sources. Revisions to the preliminary estimates are done upon receipt of actual reports of late respondents.
(Sgd.) CARMELITA N. ERICTA |
TABLE 1-A. PRODUCER PRICE INDEX, August 2006 - September 2006
(1994 =100)
Gainers | Year-on-Year Growth (percent) | |
September 2006 | August 2006 | |
| Electrical Machinery | 50.8 | 80.3 |
| Food Manufacturing | 7.0 | 7.0 |
| Footwear and Wearing Apparel* | 28.0 | 24.1 |
| Transport Equipment | 8.8 | 6.9 |
| Non-Metallic Mineral Products | 9.02 | 11.4 |
| Petroleum Products | 2.6 | 12.7 |
| Machinery Excluding Electrical* | 17.7 | 26.9 |
| Tobacco | 6.1 | 6.1 |
| Beverages | 2.3 | 3.5 |
| Textiles | 5.1 | 3.2 |
| Basic Metals | 1.8 | 0.6 |
| Paper and Paper Products | 4.0 | 4.5 |
| Rubber Products | 14.4 | 15.3 |
| Fabricated Metal Products* | 3.9 | 4.0 |
| Leather Products* | 25.1 | 25.2 |
| Wood and Wood Products | 6.9 | 7.9 |
| Chemical Products | a/ | 0.7 |
Losers | Year-on-Year Growth (percent) | |
September 2006 | August 2006 | |
| Furniture and Fixtures | -13.3 | -11.8 |
| Publishing and Printing* | -9.4 | -9.4 |
| Miscellaneous Manufactures | -4.3 | -4.5 |
TABLE 1-B. PRODUCER PRICE INDEX, August 2006 - September 2006
(1994=100)
Gainers | Month-on-Month Growth (percent) | |
September 2006 | August 2006 | |
| Footwear and Wearing Apparel* | 3.2 | 0.8 |
| Food Manufacturing | 0.4 | 0.5 |
| Basic Metals | 0.9 | 0.1 |
| Textiles | 1.4 | 0.1 |
| Machinery Excluding Electrical* | 0.3 | -0.4 |
| Paper and Paper Products | 0.2 | -0.3 |
| Rubber Products | a/ | a/ |
| Tobacco | a/ | a/ |
| Publishing and Printing* | a/ | a/ |
| Beverages | a/ | a/ |
Losers | Month-on-Month Growth (percent) | |
September 2006 | August 2006 | |
| Petroleum Products | -4.8 | -6.1 |
| Miscellaneous Manufactures | -0.7 | -1.1 |
| Furniture and Fixtures | -1.4 | -5.1 |
| Chemical Products | -0.1 | b/ |
| Electrical Machinery | b/ | -2.5 |
| Wood and Wood Products | -0.4 | 0.1 |
| Transport Equipment | -0.1 | -0.1 |
| Non-Metallic Mineral Products | b/ | -1.4 |
| Fabricated Metal Products* | -0.1 | 0.2 |
| Leather Products* | -0.1 | 2.6 |
Note: * - new sectors in the 1994-based series
a/- Less than 0.1 percent increase
b/- Less than 0.1 percent decrease
Sectors are ranked according to their contribution to the overall 1994-based September 2006 growth rate.
Year-on-year growth rates rates are computed by dividing the current month index by previous year same month index less 1.
Month-on-month growth rates are computed by dividing the current month index by previous month index less 1.
Source: National Statistics Office
Manila, Philippines