
Producer Price Index (PPI) for Agriculture (2018=100) : First Quarter 2024
A. All Commodities
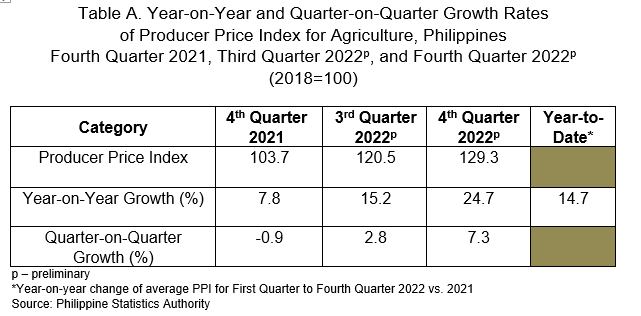
The country’s PPI for agriculture rose in the fourth quarter of 2022
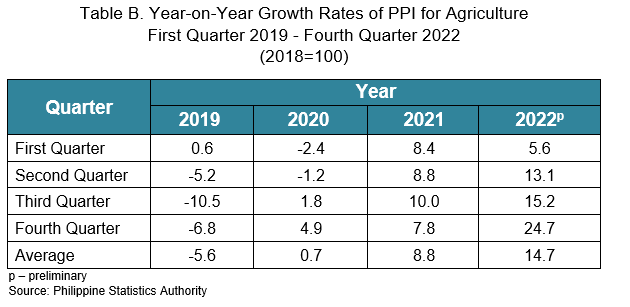
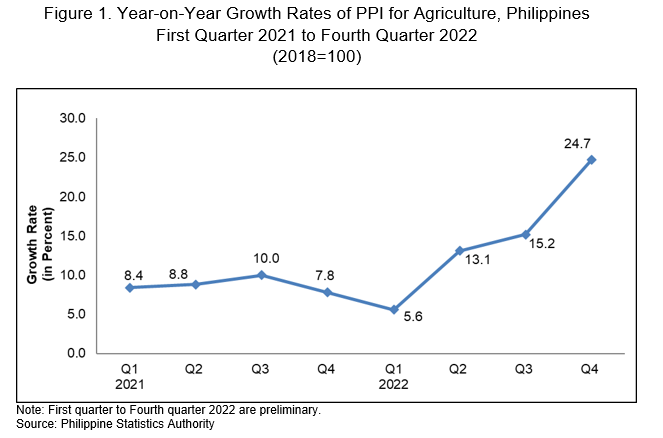
The PPI for agriculture at the national level registered an annual growth rate of 24.7 percent in the fourth quarter of 2022 from an annual hike of 15.2 percent in the previous quarter. In the fourth quarter of 2021, the annual rate was observed at 7.8 percent. (Figure 1 and Tables A, 3, and 5)
The country’s average annual growth rate of PPI for agriculture in the year 2022 was recorded at 14.7 percent. (Tables A, 3, and 5)
The highest annual growth rate for the PPI for agriculture among the regions outside the National Capital Region in the fourth quarter of 2022 was recorded in Cordillera Administrative Region (CAR) at 64.3 percent, while the lowest was posted in Region XI (Davao Region) at 1.5 percent. (Tables 3 and 5)
B. Major Commodity Group
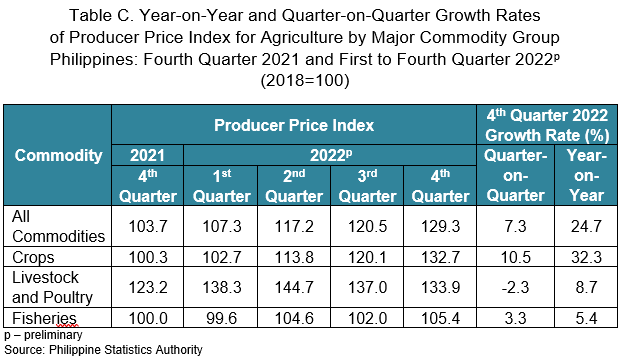
Relative to their annual increases in the third quarter of 2022, annual increments were higher in the indices of crops at 32.3 percent and fisheries at 5.4 percent in the fourth quarter of 2022. Meanwhile, lower annual growth rate was observed in the PPI for livestock and poultry at 8.7 percent. (Tables C, 3, and 7)
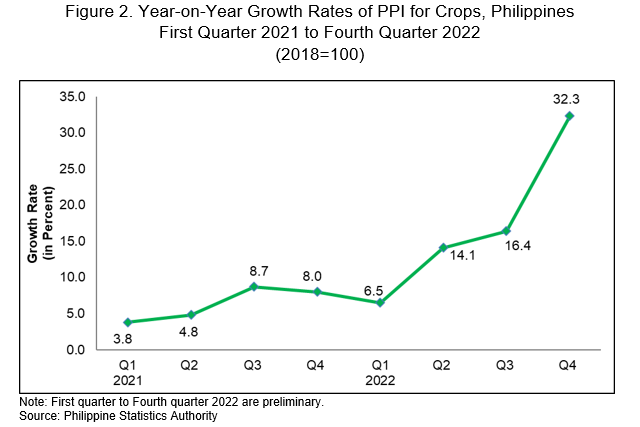
1. PPI for crops increased further in the fourth quarter of 2022
The year-on-year growth rate of PPI for crops at the national level continued to increase at 32.3 percent during the fourth quarter of 2022 from an annual growth rate of 16.4 percent in the third quarter of 2022. In the same quarter of the previous year, its annual hike was posted at 8.0 percent. (Figure 2 and Tables 3 and 7)
By commodity group, the indices of the following registered higher annual growth rates during the quarter:
a) Cereals at 9.0 percent, from 6.8 percent;
b) Rootcrops at 18.1 percent, from 12.7 percent;
c) Fruits at 3.9 percent, from 1.6 percent; and
d) Commercial crops at 60.4 percent, from 33.5 percent.
Moreover, annual increments were observed in the indices of the following commodity groups during the quarter after exhibiting negative annual rates in the previous quarter:
a) Beans and legumes at 17.0 percent, from -8.7 percent;
b) Fruit vegetables at 35.0 percent, from -16.4 percent; and
c) Leafy vegetables at 29.4 percent, from -57.7 percent.
On the other hand, the index of condiments still recorded an annual decline of -24.9 percent during the quarter. (Tables 3 and 8)
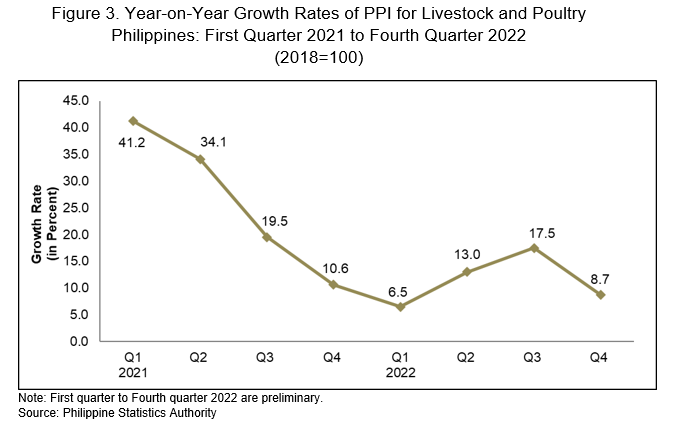
2. PPI for livestock and poultry eased in the fourth quarter of 2022
The annual increment of PPI for livestock and poultry in the country slowed down to 8.7 percent in the fourth quarter of 2022 from an annual increment of 17.5 percent in the previous quarter. Annual growth rate was recorded at 10.6 percent in the fourth quarter of 2021. (Figure 3 and Tables 3 and 10)
The indices of both livestock and poultry posted lower year-on-year growth rates during the quarter at 4.7 percent and 17.7 percent, respectively. (Tables 3 and 11)
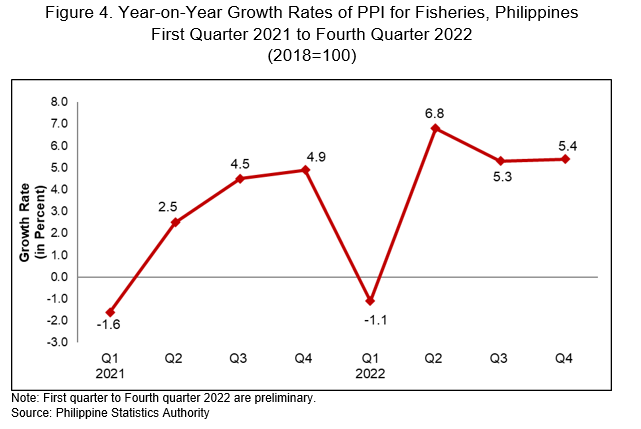
3. PPI for fisheries inched up in the fourth quarter of 2022
The year-on-year growth rate of PPI for fisheries in the Philippines picked up to 5.4 percent in the fourth quarter of 2022 from an annual growth rate of 5.3 percent in the previous quarter. Its annual change in the fourth quarter in 2021 was posted at 4.9 percent. (Figure 4 and Tables 3 and 13)
Higher annual growth rates were observed in the indices of aquaculture at 5.6 percent and commercial fisheries at 12.3 percent during the quarter. In contrast, the index of marine municipal fisheries exhibited a lower annual increment of 2.8 percent.
Annual decline was still recorded in the index of inland municipal fisheries at -1.9 percent during the period. (Tables 3 and 14)
DIVINA GRACIA L. DEL PRADO, Ph.D.
(Assistant National Statistician)
Officer-in-Charge, Deputy National Statistician
Sectoral Statistics Office