
Producer Price Index (PPI) for Agriculture (2018=100) : First Quarter 2024
A. All Commodities
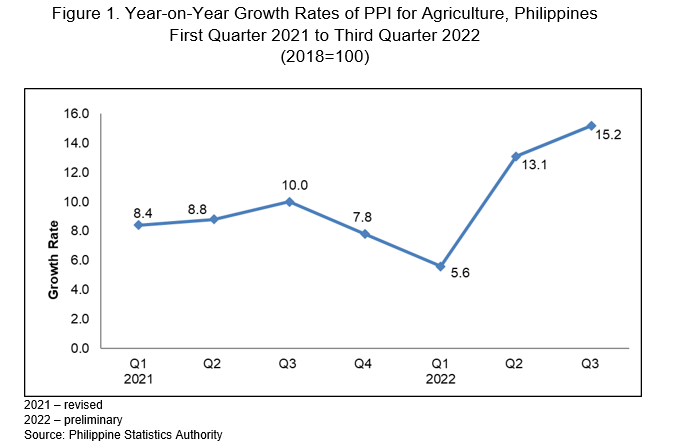
PPI for agriculture at the national level increased further in the third quarter of 2022
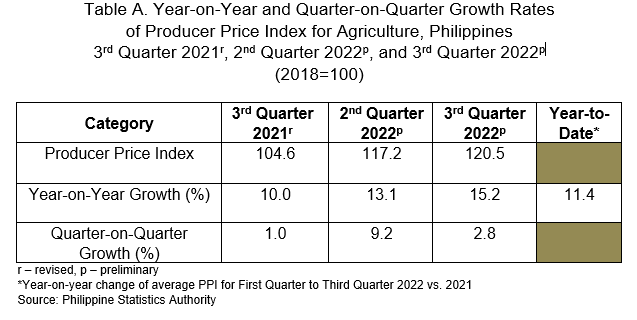
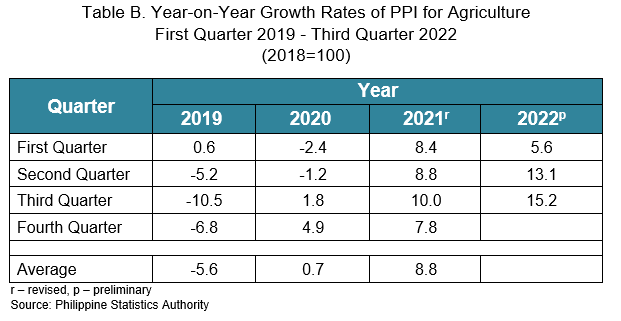
The Philippines’ Producer Price Index (PPI) for agriculture recorded an annual growth rate of 15.2 percent in the third quarter of 2022, from an annual increment of 13.1 percent in the previous quarter. Its annual change in the third quarter of 2021 was posted at 10.0 percent. (Figure 1 and Tables A, 3, and 5)
This brings the national average growth rate of PPI for agriculture for the first to third quarter of 2022 at 11.4 percent. (Table A)
Region VIII (Eastern Visayas) recorded the highest annual growth rate of 57.7 percent among the regions outside the National Capital Region. Meanwhile, the only region which had annual decline was Region X (Northern Mindanao) with -1.4 percent. (Table 5)
B. Major Commodity Group
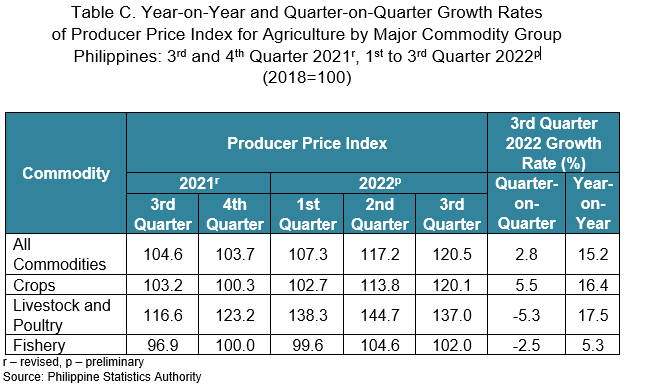
Higher year-on-year growth rates were, likewise, noted in the PPIs for crops at 16.4 percent, and livestock and poultry at 17.5 percent. On the contrary, lower annual hike was posted in the PPI for fishery at 5.3 percent. (Tables C and 3)
1. PPI for crops accelerated in the third quarter of 2022
The annual growth rate of PPI for crops in the Philippines rose further to 16.4 percent during the third quarter of 2022, from 14.1 percent in the previous quarter. In the third quarter of 2021, the annual hike was posted at 8.7 percent. (Figure 2, and Tables 3 and 7)
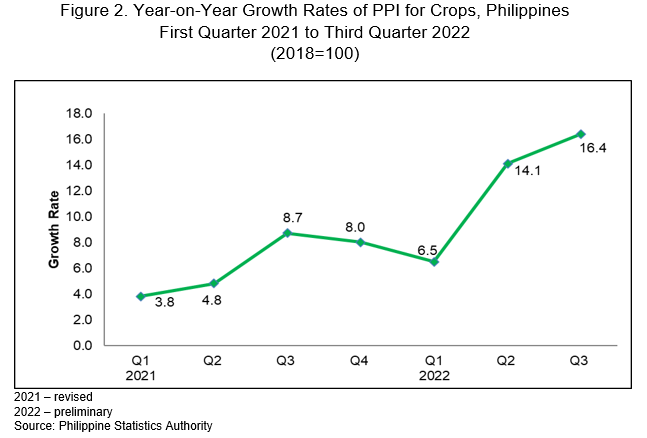
The index of commercial crops registered a 33.5 percent increase year-on-year in the third quarter of 2022, from 23.6 percent in the previous quarter. In addition, an annual increment of 1.6 percent was observed in the index of fruits, from a negative growth rate of -10.0 percent in the previous quarter.
On the contrary, year-on-year increments were slower in the indices of cereals at 6.8 percent from 8.0 percent in the second quarter of 2022, and rootcrops at 12.7 percent from 16.4 percent in the previous quarter.
Meanwhile, the indices of the following commodity groups posted negative annual growth rates from annual hikes in the previous quarter:
a) Beans and legumes at -8.7 percent, from 2.5 percent;
b) Fruit vegetables at -16.4 percent, from 18.7 percent; and
c) Leafy vegetables at -57.7 percent, from 16.0 percent.
Annual decline was still recorded in the index of condiments during this quarter at -46.4 percent. (Tables 3 and 8)
2. PPI for livestock and poultry went up in the third quarter of 2022
PPI for livestock and poultry at the national level posted an annual increment of 17.5 percent in the third quarter of 2022, from an annual growth rate of 13.0 percent in the previous quarter. In the same quarter of the previous year, its annual change was recorded at 19.5 percent. (Figure 3, Tables 3 and 10)
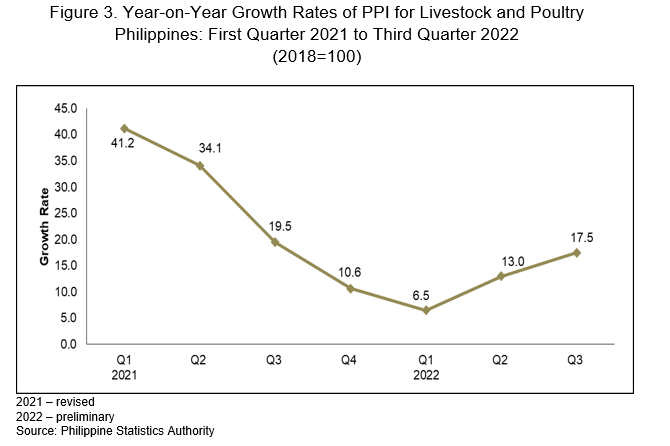

Higher year-on-year hikes were observed in the indices of both livestock and poultry during the quarter with 11.1 percent and 30.8 percent annual growth rates, respectively. (Tables 3 and 11)
3. PPI for fishery decreased during the third quarter of 2022
The annual growth rate of PPI for fishery in the country slowed down to 5.3 percent in the third quarter of 2022, from an annual increment of 6.8 percent last quarter. Its annual change in the third quarter in 2021 was registered at 4.5 percent. (Figure 4, and Tables 3 and 13)
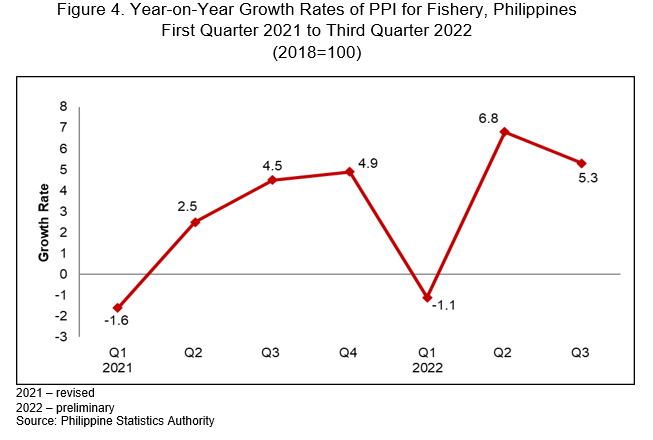
In the third quarter of 2022, lower annual increases were also observed in the indices of aquaculture at 2.5 percent, commercial fishery at 11.0 percent, and marine municipal fishery at 8.1 percent.
Moreover, the index of inland municipal fishery recorded an annual decline of -4.7 percent from an annual growth rate of 0.3 percent in the previous quarter. (Tables 3 and 14)
DIVINA GRACIA L. DEL PRADO, Ph.D.
(Assistant National Statistician)
Officer-in-Charge, Deputy National Statistician
Sectoral Statistics Office