
I. Introduction
- Background
The stability and growth of a country’s economy hinges on its ability to produce goods and services for both domestic and international use. Labor represents an important factor of production, hence, the improvement of the quality of the labor force, and efforts to make it more productive and responsive to growth are necessary for the development of the economy. A clear knowledge and understanding of the size, composition, and other characteristics of the segment of the population is a big step in this direction. A continuing supply of the data on labor force is indispensable to national and local development planning.
The Labor Force Survey (LFS) is a nationwide quarterly survey of households conducted by the Philippine Statistics Authority (PSA) to gather data on the demographic and socio-economic characteristics of the population.
Objectives
The LFS aims to provide a quantitative framework for the preparation of plans, and formulation of policies affecting the labor market.
Specifically, the survey is designed to provide statistics on levels and trends of employment, unemployment, and underemployment for the country, as a whole, and for each of the administrative regions.
Scope and Coverage
With regions as domain, survey operations for April 2022 LFS ran for 18 days from 08 to 30 April 2022 excluding 17 to 18 April 2022 and covered 43,500 eligible sample households.
Overseas Filipino Workers are not considered part of the labor force in the Philippines. Hence, in the LFS, data on economic characteristics of household members who are overseas workers are not collected. In the LFS report, they are excluded in the estimation of the size of working population, i.e., population aged 15 years and older, and in the estimation of the labor force.
Developments in the LFS
The LFS, as in any survey, adopts recent developments in statistical methodology/processes and in the education system. The revisions in the LFS are as follows:
| Item | Developments |
| Population projections | The population projections based on the 2015 Population Census (POPCEN 2015) has been adopted to generate the labor force statistics. For comparability, population projections based on the POPCEN 2015 was likewise used in the October 2019 labor force statistics. |
| Adoption of the Philippine Standard Industrial Classification (PSIC) | Starting April 2012 LFS, the codes for industry adopted the 2009 PSIC. Prior to this, codes for industry used the 1994 PSIC. |
| Adoption of the Philippine Standard Occupation Classification (PSOC) | The 2012 PSOC was adopted starting April 2016. The 1992 PSOC had been used prior to this rounds. |
| Adoption of the Philippine Standard Classification of Education (PSCED) | In January 2019, the 2017 Philippine Standard Classification of Education (PSCED) has been adopted. The categories for highest grade completed were also revised considering the K to 12 program in the education system. |
| Data Collection |
|
| Additional Questions |
a. working arrangement; |
II. Concepts and Definitions
Reference Period
The reference period for this survey is the “past week” referring to the past seven (7) days preceding the date of visit of the enumerator or the interviewer.
Employment Status Concepts
1. Population 15 Years Old and Over
This refers to number of population 15 years old and over excluding overseas workers. Overseas workers are excluded in the estimation of the size of working population (population aged 15 years and over) since the data on their economic characteristics are not collected because they are not considered part of the labor force in the country.
2. In the Labor Force or Economically Active Population
This refers to persons 15 years old and over who are either employed or unemployed in accordance with the definitions described below.
3. Employed
Employed persons include all those who, during the reference period are 15 years old and over as of their last birthday, and are reported either:
At work, i.e., those who do any work even for one hour during the reference period for pay or profit, or work without pay on the farm or business enterprise operated by a member of the same household related by blood, marriage, or adoption; or
With a job but not at work, i.e., those who have a job or business but are not at work because of temporary illness or injury, vacation, or other reasons. Likewise, persons who expect to report for work or to start operation of a farm or business enterprise within two weeks from the date of the enumerator’s visit are considered employed.
4. Underemployed
Underemployed persons include all employed persons who express the desire to have additional hours of work in their present job, or an additional job, or to have a new job with longer working hours. Visibly underemployed persons are those who work for less than 40 hours during the reference period and want additional hours of work.
5. Unemployed
Starting April 2005, the new unemployment definition was adopted per NSCB Resolution Number 15 dated October 20, 2004. As indicated in the said resolution:
Unemployed persons include all those who, during the reference period, are 15 years old and over as of their last birthday, and reported as persons:
a) Without work, i.e., had no job or business during the reference period;
b) Currently available for work, i.e., were available and willing to take up work in paid employment or self-employment during the reference period, and/or would be available and willing to take up work in paid employment or self-employment within two weeks after the interview date; and
c) Seeking work, i.e., had taken specific steps to look for a job or establish a business during the reference period, or
Not seeking work due to the following reasons: (1) fatigued or believed no work available, i.e., discouraged workers; (2) awaiting results of previous job application; (3) temporary illness or disability; (4) bad weather; and/or (5) waiting for rehire or job recall.
6. Persons Not in the Labor Force
Persons 15 years old and over who are neither employed nor unemployed according to the definitions mentioned. Those not in the labor force are persons who are not looking for work because of reasons such as housekeeping, schooling, and permanent disability. Examples are housewives, students, persons with disability, or retired persons.
III. Sampling Design and Estimation Methodology
The LFS, being a household-based survey, used the 2013 Master Sample (MS) design of which 4 replicates equivalent to a total of 42,768 Secondary sampling Units (SSUs) or sample housing units were included as samples. Using a two-stage cluster sampling design, EAs/barangays were selected at the initial sampling stage as the primary sampling units (PSUs), while the housing units within the selected PSUs are selected as the secondary sampling units (SSUs). Generally, all households within the sample housing unit are also considered as sample households. However, for housing unit with more than three (3) households, a maximum of three (3) sample households were randomly selected.
Sampling Frame
The 2013 MS sampling frame was constructed based on the results of the 2010 Census of Population and Housing. This was refreshed with the 2015 Census of Population results where the EA Reference File (EARF) was used as the PSU frame and the 2015 list of households for each of the PSUs were used as the SSU frame.
Sampling Domain
To provide subnational or provincial level statistics with precise estimates, the 2013 MS has 117 major domains as follows: 81 provinces (including the newly created province Davao Occidental); 33 highly urbanized cities (including 16 cities in the National Capital Region); and 3 other areas (Pateros, Isabela City, and Cotabato City).
Primary Sampling Units
In the 2013 Master Sample Design, each sampling domain (i.e., province/HUC) is divided into exhaustive and non-overlapping area segments known as Primary Sampling Units (PSUs) with about 100 to 400 households. Thus, a PSU can be a barangay/Enumeration Area (EA) or a portion of a large barangay, or two or more adjacent small barangays/EAs.
2x2x2 Implicit Stratification
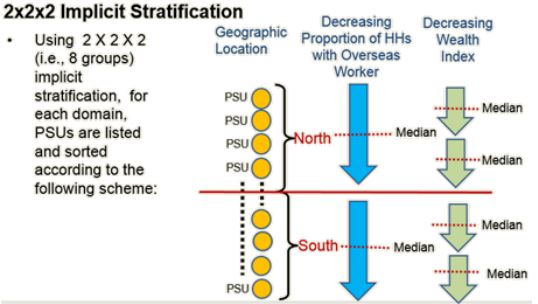
The PSUs are then ordered according to the following: (1) North-South/West-East Geographic location; (2) Decreasing Proportion of HHs with Overseas Worker; and (3) Decreasing wealth Index.
Replicates
Four replicates are used in all 117 sampling domains. A replicate is composed of ordered list of PSUs. Most of the provinces, that is, 75 out of 81, has six PSUs per replicate while in HUCs, eight PSUs form a replicate. Small domains such as Guimaras, Siquijor, Camiguin, Apayao, and Dinagat Islands had three PSUs per replicate.
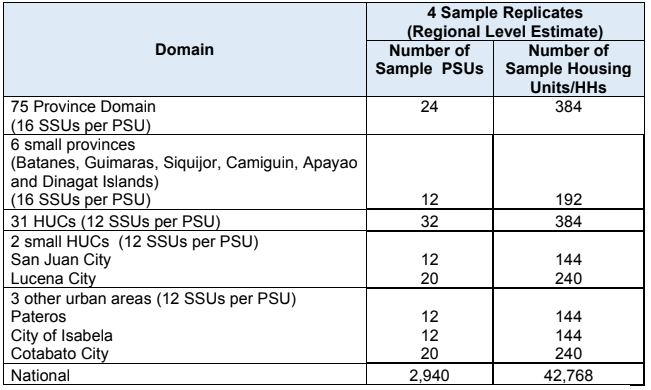
Sample Allocation Scheme
A total of four sample replicates were allotted for regional level estimates. However, the total number of sample SSUs was allotted proportionately to the measure of size of the PSU. Thus, a PSU with only 100 HHs had less number of sample HHs than PSUs with 400 HHs but, on the average, there were 12 sample HHs allotted for each PSU in Highly Urbanized Cities (HUCs) and an average of 16 sample HHs for every PSU in the province
A total national sample of 42,768 sample HHs was allotted for the quarterly rounds of the LFS.
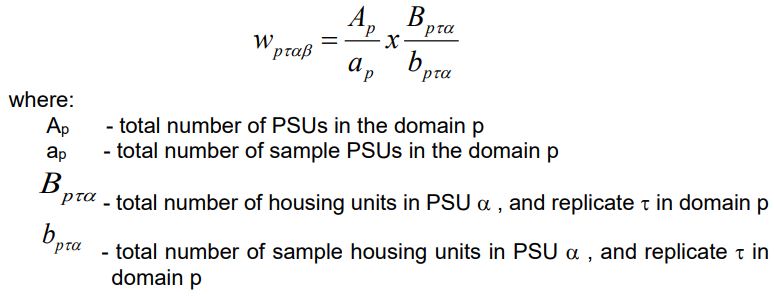
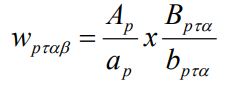
Base weight computation
The base weight is computed as the inverse of selection probability
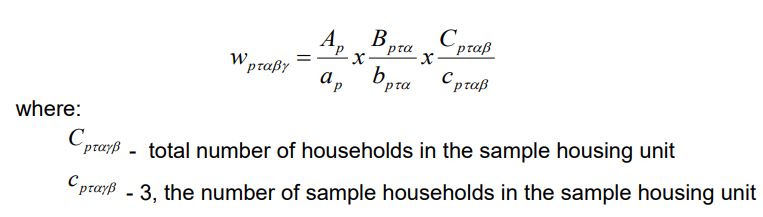
For housing units with at most 3 households the base weight is computed as
For housing units with more than 3 households the base weight is computed as
Base Weight Adjustment
The base weight was adjusted for unit non-response and was further calibrated to conform to the known or projected population count. The projected population count used was April 2022.
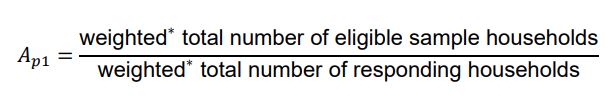
For unit non-response adjustment (within domain p), the adjustment was computed as:
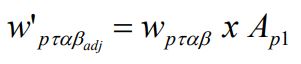
Applying this to the base weight, we have:
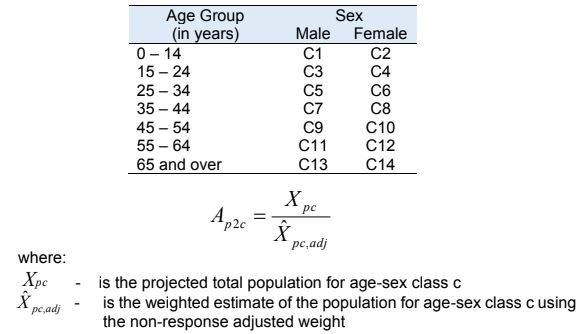
Further calibration was made to conform with known population count, as follows:
Hence the final weight (calibrated weight was):
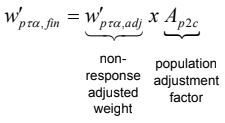
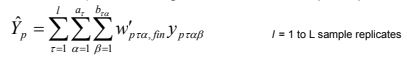
Estimation of Totals
Generally, the estimate for the weighted total for a sampling domain (province/HUC) considering the number of sample replicates was derived using:
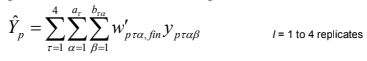
For each of the sampling domain which considered 4 sample, the estimate for the weighted total was derived using:
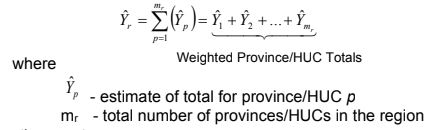
For the region
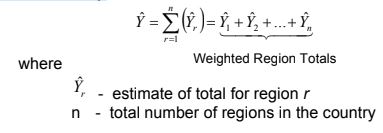
The estimate for the weighted total for the region was derived as the sum of its weighted provinces/HUCs domain totals:
For the entire country
Estimation of Proportions
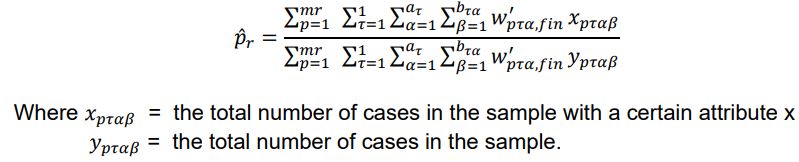
To estimate the weighted proportion p̂r in the rth region
Estimation of Sampling Error
Sampling error is usually measured in terms of the standard error for a particular statistic (mean, percentage, etc.), which is the square root of the variance.
If the sample had been selected as a simple random sample, it would have been possible to use straightforward formulas for calculating sampling errors. However, the LFS is the result of a multi-stage design, and it was necessary to use more complex formulas.
Sampling errors are computed using statistical programs. These statistical programs use the Taylor linearization method to estimate variances for survey estimates that are means, proportions, or ratios.
The Taylor linearization method treats any percentage or average as a ratio estimate, r=y/x, where y represents the total sample value for variable y, and x represents the total number of cases in the group or subgroup under consideration. The variance of r is computed using the formula given below, with the standard error being the square root of the variance:

In the LFS, the 117 province/HUC domains are also treated as natural stratification while the primary sampling units (PSUs) are treated as clusters.
Data Checking, Coding and Filtering Prior to Estimation of Proportions
Enumeration is a highly complex operation, and it may happen that reported/encoded entries during data collection may have some omissions, and implausible/inconsistent entries. Editing is a process meant to correct these errors.
During the interview, embedded editing was activated and errors/inconsistent entries were detected by the program. Editing was also done using Computer Aided Field Editing (CAFE) program after every interviewed household to ensure completeness and consistency of encoded entries. For monitoring of the status of data collection, LFS raw data from the tablet is uploaded to the PSA Central Office server as soon as the interview of a household/EA was completed.
Review and verification of the PSOC and PSIC codes and invalid values for LFS data items were done in the provincial office using the LFS Information System (LFS IS). Further processing in the regional office such as ID validation, and completeness check, edit and matching of LFS sample households with the original List from Master Sample (MS) Form 6 were done to ensure that the number of household listed was fully covered.
Preliminary, and final tabulations of data were done at the PSA Central Office.
IV. Dissemination of Results
The April 2022 LFS preliminary results press release, and the statistical tables are publicly available at the PSA website www.psa.gov.ph. The final estimates of the April 2022 LFS will be released through the following:
Special Releases, six months after the data collection; and
ISH Bulletin, 10 months after the data collection.
VI. Contact Information
For technical concerns, you may contact the following PSA focal persons:
WILMA A. GUILLEN
Assistant National Statistician
Social Sector Statistics Service
Sectoral Statistics Office
Philippine Statistics Authority
Email address: wilms038@yahoo.com
cc: ssss.oans@gmail.com
Telephone: (632) 8376-1883
MECHELLE M. VIERNES
Chief Statistical Specialist
Income and Employment Statistics Division
Social Sector Statistics Service
Sectoral Statistics Office
Philippine Statistics Authority
Email address: psa.iesd.staff@psa.gov.ph
cc: mechelle.viernes@gmail.com
Telephone: (632) 8376-2092
For data requests, you may contact PSA focal person:
SIMONETTE A. NISPEROS
Information Officer V
Knowledge Management and Communications Division
Information Technology Statistics Division
Office of the National Statistician
Philippine Statistics Authority
Email address: info@psa.gov.ph
cc: kmcd.staff@psa.gov.ph
Telephone: (632) 8462-6600 local 839