
Water collection, treatment and supply leads the sector
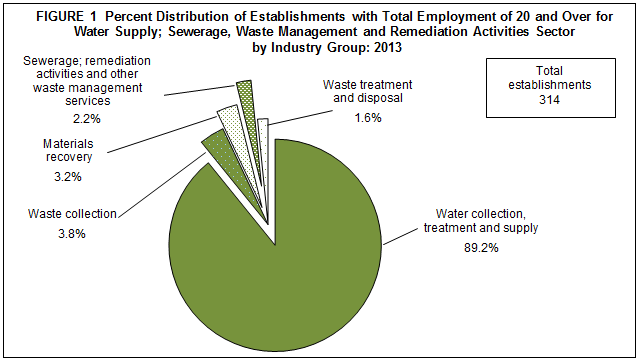
Preliminary results of 2013 Annual Survey of Philippine Business and Industry (ASPBI) showed that there were 314 establishments with total employment (TE) of 20 and over engaged in water supply; sewerage, waste management and remediation activities.
Among the industries, water collection, treatment and supply led the sector with 280 establishments accounting for 89.2 percent of the total. Waste collection ranked a far second with 12 establishments (3.8%), followed by materials recovery with 10 establishments or 3.2 percent of the total count. Figure 1 shows the distribution of establishments with TE of 20 and over for water supply; sewerage, waste management and remediation activities sector by industry group in 2013.
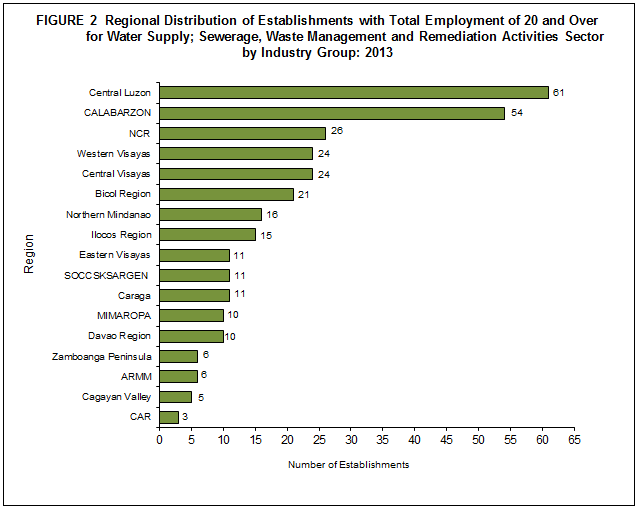
The top three regions, in terms of number of establishments, were all located in Luzon area, comprising 44.9 percent of the total. Central Luzon led the regions where a total of 61 establishments (19.4%) were located. This was followed by CALABARZON and National Capital Region (NCR) with 54 (17.2%) and 26 establishments (8.3%), respectively. On the other hand, Cordillera Administrative Region (CAR) recorded the least count with only 3 establishments (1.0%). Figure 2 illustrates the regional distribution of establishments with TE of 20 and over for water supply; sewerage, waste management and remediation activities sector by industry group in 2013.
Water collection, treatment and supply employs 25,409 workers
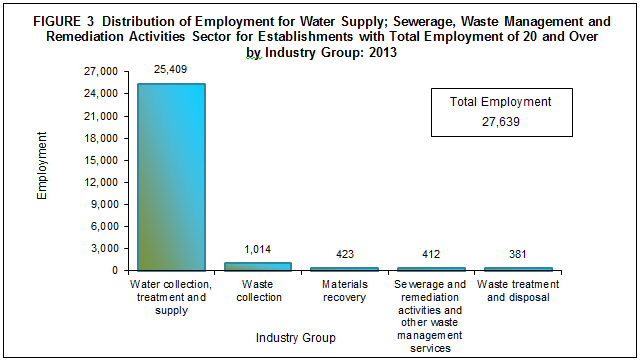
Total employment generated by establishments with 20 and over reached 27,639 in 2013. Of the total workforce, 27,507 workers (99.5%) were paid employees and the rest were working owners and unpaid workers.
By industry group, water collection, treatment and supply, having the most number of establishments, also emerged as the top employer with 25,409 workers or 91.9 percent of the total. Waste collection placed a far second with 1,014 workers (3.7%), followed by materials recovery with only 423 workers (1.5%). Figure 3 shows the distribution of employment for water supply; sewerage, waste management and remediation activities sector for establishments with TE of 20 and over by industry group in 2013.
National Capital Region (NCR), which ranked third in terms of the number of establishments, employed most of the workers with 5,238 or 19.0 percent of the total, followed by Central Luzon with 4,425 (16.0%) workers. Completing the top three regions with most number of workers is CALABARZON with 4,386 (15.9%).
Employees of water collection, treatment and supply are the highest paid
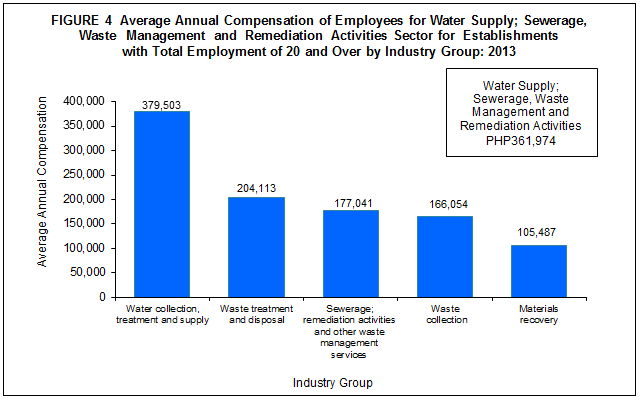
Total compensation paid in 2013 by establishments with TE of 20 and over, amounted to PHP10.0 billion, translating to an average annual compensation of PHP361,974 per employee.
Employees working in water collection, treatment and supply were the highest paid receiving an average annual compensation of PHP379,503. This was followed by employees working in waste treatment and disposal with average pay of PHP204,113, and sewerage; remediation activities and other waste management services at PHP177,041 per employee. On the other hand, employees in materials recovery received the lowest average annual pay of PHP105,487. Figure 4 shows the average annual compensation of employees for water supply; sewerage, waste management and remediation activities sector for establishments with TE of 20 and over by industry group in 2013.
By region, employees in NCR received the highest average annual pay of PHP691,617. This was followed by employees in Central Visayas and Davao Region receiving an average annual compensation of PHP375,996 and PHP331,053, respectively.
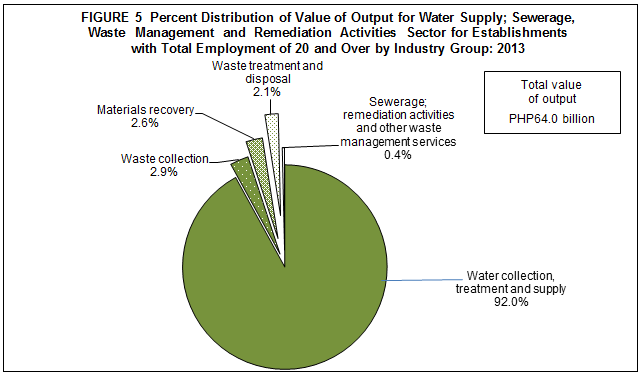
Value of output amounts to PHP64.0 billion
Total value of output generated by establishments with TE of 20 and over was estimated at PHP64.0 billion.
Water collection, treatment and supply which produced the highest output value of PHP58.9 billion accounted for 92.0 percent of the total. The shares of other industries to the total value of output are as follows:
- Waste collection, PHP1.9 billion (2.9%)
- Materials recovery, PHP1.7 billion (2.6%)
- Waste treatment and disposal, PHP1.3 billion (2.1%)
- Sewerage, and remediation activities and other waste management services, PHP0.2 billion (0.4%)
Figure 5 shows the distribution of value of output for water supply; sewerage, waste management and remediation activities sector for establishments with TE of 20 and over by industry group in 2013.
Among regions, NCR shared the biggest output value with PHP36.3 billion or more than half (56.7%) of the total value of output. This was distantly followed by CALABARZON and Central Luzon with an output value of PHP6.8 billion each.
Total expense reaches PHP53.5 billion
Total expense, including compensation, amounted to PHP53.5 billion in 2013.
Among industries, water collection, treatment and supply incurred the highest expense amounting to PHP48.9 billion or 91.4 percent of the total. Waste collection and materials recovery followed next with PHP1.7 billion (3.2%) each.
At the regional level, more than half (58.9%) or PHP31.5 billion was incurred by establishments located in NCR, the highest among the regions. CALABARZON and Central Luzon ranked a far second and third spending PHP5.5 billion (10.3%) and PHP5.0 billion (9.3%), respectively.
Water collection, treatment and supply recorded the highest returns
Income per expense ratio for establishments with TE of 20 and over in 2013 was recorded at 1.36, indicating that for every peso spent PHP1.36 was realized in terms of income.
Two industries surpassed the sector’s income per expense ratio, namely: waste treatment and disposal, and water collection, treatment and supply with respective income-expense ratio of 1.40 and 1.38. The income-expense ratio of other industries are as follows:
- Sewerage; remediation activities and other waste management services (1.14)
- Waste collection (1.07)
- Materials recovery (1.00)
Among regions, MIMAROPA registered the highest return at 1.52. Davao Region and NCR placed second and third with 1.46 and 1.45 income per peso expense, respectively.
Value Added stands at PHP39.4 billion
Value added generated by establishments with TE of 20 and over reached PHP39.4 billion in 2013.
At the industry level, water collection, treatment and supply contributed the biggest share to value added amounting to PHP38.4 billion or 97.4 percent of the total. Waste treatment and disposal ranked a far second with PHP514.4 million (1.3%) followed by waste collection with PHP403.1 million (1.0%). Materials recovery generated the least with a mere share of PHP42.4 million (0.1%).
NCR led the regions in terms of value added, generating more than half (58.4%) or PHP23.0 billion. This was followed by Central Luzon and CALABARZON with respective shares of PHP4.1 billion (10.4%) and PHP3.1 billion (7.9%).
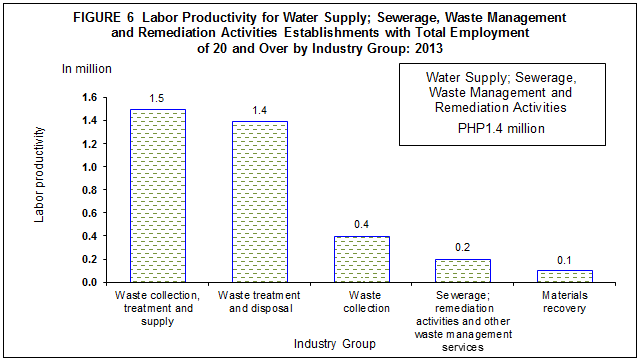
Labor productivity is PHP1.4 million per worker
The ratio of value added per worker, a measure of labor productivity, was estimated at PHP1.4 million for establishments with TE of 20 and over.
The highest labor productivity was recorded by water collection, treatment and supply valued at PHP1.5 million per worker, followed closely by waste treatment and disposal with PHP1.4 million. Labor productivity of other industries are as follows:
- Waste collection (PHP0.4 million per worker)
- Sewerage; remediation activities and other waste management services (PHP0.2 million per worker)
- Materials recovery (PHP0.1 million per worker)
Figure 6 shows the labor productivity for water supply; sewerage, waste management and remediation activities sector for establishments with TE of 20 and over by industry group in 2013.
Among regions, workers in NCR were the most productive generating PHP4.4 million per worker. This was followed by workers in Cagayan Valley and Central Luzon with respective productivity of PHP1.0 and PHP0.9 million per worker.
Gross Addition to Tangible Fixed Assets amounts to PHP3.5 billion
Gross addition to tangible fixed assets, defined as capital expenditures less sale of fixed assets, was valued at PHP3.5 billion for establishments with TE of 20 and over.
Water collection, treatment and supply acquired PHP3.4 billion or 95.9 percent of the total. Gross addition to fixed assets of other industries are as follows:
- Waste collection (PHP96.5 million)
- Waste treatment and disposal (PHP45.8 million)
- Sewerage; remediation activities and other waste management services (PHP1.2 million)
- Materials recovery (PHP0.1 million)
Subsidies received amount to PHP96.1 million
Total subsidies provided by the government to support the business operation of establishments with TE of 20 and over amounted to PHP96.1 million.
Water collection, treatment and supply industry was the only recipient of subsidies in 2013.
TECHNICAL NOTES
Introduction
This Special Release presents the preliminary results of the 2013 ASPBI for the Water Supply; Sewerage, Waste Management and Remediation Activities sector for establishments with total employment of 20 and over.
The 2013 ASPBI is a forerunner of the 2010 ASPBI and one of the designated statistical activities of the Philippine Statistics Authority (PSA). Data collected from the survey provide information on the levels, structure, performance, and trends of economic activities of the formal sector in the entire country for the year 2013.
The survey was conducted nationwide in September 2014 with the year 2013 as the reference period of data, except for employment which is as of November 15, 2013.
Data are presented at the national and industry group or 3-digit 2009 Philippine Standard Industrial Classification (PSIC) and at the regional level.
Legal Authority
The conduct of the 2013 ASPBI is authorized under Republic Act 10625 known as the Philippine Statistical Act of 2013 - Reorganizing and strengthening of the Philippine Statistical System (PSS), its agencies and instrumentalities.
Scope and Coverage
The 2013 ASPBI covered establishments engaged in 18 economic sectors classified under the 2009 PSIC, namely:
- Agriculture, Forestry and Fishing (A)
- Mining and Quarrying (B)
- Manufacturing (C)
- Electricity, Gas, Steam, and Air Conditioning Supply (D)
- Water Supply; Sewerage, Waste Management and Remediation Activities (E)
- Construction (F)
- Wholesale and Retail Trade; Repair and Maintenance of Motor Vehicles, Motorcycles (G)
- Transportation and Storage (H)
- Accommodation and Food Service Activities (I)
- Information and Communication (J)
- Financial and Insurance Activities (K)
- Real Estate Activities (L)
- Professional, Scientific and Technical Activities (M)
- Administrative and Support Service Activities (N)
- Education (P)
- Human Health and Social Activities (Q)
- Arts, Entertainment and Recreation (R)
- Other Service Activities (S)
The survey was confined to the formal sector of the economy, which consists of the following:
- Corporations and partnership
- Cooperatives and foundations
- Single proprietorship with employment of 10 and over
- Single proprietorships with branches
Frame of Establishments
The frame for the 2013 ASPBI was extracted from the 2013 List of Establishments (LE). The estimated number of establishments in operation in the country in 2013 totaled to 941,000. About 263,000 establishments (28.0% of the total establishments) belong to the formal sector of which 229,000 (87.0%) comprised the establishment frame. This frame was used to draw the sample establishments for the survey.
Unit of Enumeration
The unit of enumeration for the 2013 ASPBI is the establishment. An establishment is defined as an economic unit under a single ownership or control which engages in one or predominantly one kind of activity at a single fixed location.
Classification of Establishments
An establishment is categorized by its economic organization, legal organization, industrial classification, employment size, and geographic location.
Economic Organization refers to the organizational structure or role of the establishment in the organization. An establishment may be single establishment, branch, establishment and main office with branches elsewhere, main office only, and ancillary unit other than main office.
Legal Organization refers to the legal form of the economic entity which owns the establishment. An establishment may be single proprietorship, partnership, government corporation, stock corporation, non-stock corporation, and cooperative.
The industrial classification of an economic unit was determined by the activity from which it derives its major income or revenue. The 2009 PSIC was utilized to classify economic units according to their economic activities.
The size of an establishment is determined by its total employment (TE) as of specific date.
Geographic Classification. Establishments are also classified by geographic area using the Philippine Standard Geographic Code (PSGC) classification.
Methodology
Sampling Design
The survey utilized stratified sampling with 5-digit PSIC serving as the first stratification variable and total employment as the second stratification variable.
For establishments with TE of 20 and over, the 17 administrative regions serve as the geographic domains while the 5-digit level of the 2009 PSIC serves as the industry domains.
Estimation Procedure for Establishments with TE of 20 and Over
- Non-Certainty Stratum (strata of TE 20 to 49 and TE 50 to 99)
The estimate of the total of a characteristic  for the non-certainty employment strata in an industry domain in each region,
where:
s denotes the non-certainty employment strata in TE of 20 and over
p = 1, 2,..., 17 regions (geographic domains)
xspj = value of the jth establishment in the non-certainty employment strata
in TE of 20 and over for an industry domain in each region
j = 1, 2, 3,…, nsp establishments
 = weight of the jth establishment in the non-certainty employment strata
in TE of 20 and over for an industry domain in each region
Nsp = total number of establishments in the non-certainty employment strata
in TE of 20 and over for an industry domain in each region
nsp = number of sample establishments in the non-certainty employment strata
in TE of 20 and over for an industry domain in each region
- Certainty Stratum (TE 100 and over)
The estimate of the total of a characteristic  for the certainty employment stratum in an industry domain in each region,
where:
c denotes the certainty employment strata in TE of 20 and over
p = 1, 2,..., 17 regions (geographic domains)
xcpj = value of the jth establishment in the certainty employment strata
in TE of 20 and over in an industry domain within each region
j = 1, 2, 3, …, mcp establishments
mcp = number of establishments in the certainty employment strata
in TE of 20 and over in an industry domain within each region
- Total Estimate for TE of 20 and Over
The estimate of the total of a characteristic  for the industry domain in each region (geographic domain) was obtained by aggregating the estimates for all employment strata (non-certainty and certainty) in the same industry domain,
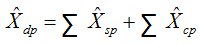
where dp denotes the industry domains in each region.
National level estimates of the characteristics by industry domain were obtained by aggregating separately the estimates for the particular industry domain from all the regions.
Weight Adjustment Factor for Non-Response
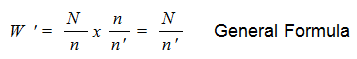
To account for non-response in the non-certainty strata, the adjustment factor (n/n’) was multiplied with the sampling weight (W) of each of the sampling unit. The sampling weight, defined as N/n, was recomputed as
Thus, the adjusted weight (W’spj) for the non-certainty employment stratum for the industry domain with TE 20-99 was
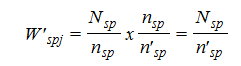
where:
Nsp = total number of establishments in the non-certainty employment stratum
with TE 20-99 for the industry domain within each geographic domain (region)
n’sp = number of responding establishments in the non-certainty employment stratum
with TE 20-99 for the industry domain within each geographic domain (region)
Response Rate
Response rate for Water Supply; Sewerage, Waste Management and Remediation Activities Sector for establishments with TE of 20 and over was 96.0 percent (308 out of 321 establishments). This included receipts of "good" questionnaires, partially accomplished questionnaires, reports of closed, moved out or out of scope establishments.
Reports of the remaining non-reporting establishments were imputed based on established imputation methods and from other available administrative data sources. However, reports of establishments which were found to be duplicates and out of business in 2013, were not imputed.
Limitation of Data
Only the formal sector was covered in the survey.
Concepts and Definitions of Terms
Economic activity is the establishment’s source of income. If the establishment is engaged in several activities, its main economic activity is that which earns the biggest income or revenue.
Total employment is the number of persons who worked in for the establishment as of November 15, 2013.
Paid employees are all persons working in the establishment and receiving pay, as well as those working away from the establishment paid by and under the control of the establishment. Included are all employees on sick leave, paid vacation or holiday. Excluded are consultants, home workers, receiving pure commissions only, and workers on indefinite leave.
Compensation is the sum of salaries and wages, separation/retirement/terminal pay, gratuities, and payments made by the employer in behalf of the employees such as contribution to SSS/GSIS, ECC, PhilHealth, Pag-ibig, etc.
Salaries and wages are payments in cash or in kind to all employees, prior to deductions for employee’s contributions to SSS/GSIS, withholding tax, etc. Included are total basic pay, overtime pay and other benefits.
Income or Revenue refers to cash received and receivables for goods/products and by-products sold and services rendered.
E-commerce refers to the selling of products or services over electronic systems such as Internet Protocol-based networks and other computer networks. Electronic Data Interchange (EDI) network, or other on-line system. Excluded are orders received from telephone, facsimile and e-mails.
Cost refers to all expenses incurred during the year whether paid or payable. Valuation is at purchaser prices including taxes and other charges, net of rebates, returns and allowances. Goods and services received by the establishment from other establishments of the same enterprise are valued as though purchased.
Expense refers to cost incurred by the establishment during the year whether paid or payable. This is treated on a consumed basis.
Intermediate expense are expenditures incurred in the production of goods such as materials and supplies purchased, fuels purchased, electricity and water purchased, and industrial services done by others plus beginning inventory of materials, supplies and fuels less ending inventory of materials, supplies and fuels.
Value added is gross output less intermediate input. Gross output for the water supply; sewerage, waste management and remediation activities sector is value of output plus income from non-industrial services done for others (except rent income from land). Intermediate input is intermediate expense plus expense for non-industrial services done by others (except rent expense for land) and other expenses.
Value of output represents the sum of the receipts from revenue from main activity, income from industrial services done for others, goods sold in the same condition as purchased less the cost of goods sold and value of fixed assets produced on own account.
Gross addition to tangible fixed assets is equal to capital expenditures less sale of fixed assets, including land.
Change in inventories is equivalent to the value of inventories at the end of the year less the value of inventories at the beginning of the year.
Inventories refer to the stock of goods owned by and under the control of the establishment as of a fixed date, regardless of where the stocks are located. Valuation is at current replacement cost in purchaser prices. Replacement cost is the cost of an item in terms of its present price rather than its original cost.
Subsidies are all special grants in the form of financial assistance or tax exemption or tax privilege given by the government to aid and develop an industry.