
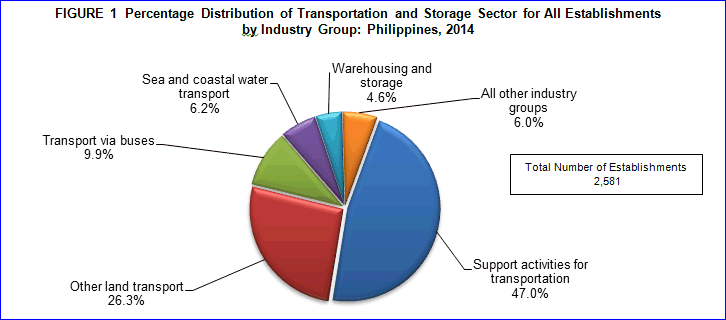
Support activities for transportation industry dominates the sector
Final results of the 2014 Annual Survey of Philippine Business and Industry showed that a total of 2,581 establishments engaged in transportation and storage. More than half of the total were establishments with total employment (TE) of less than 20 with 1,469 establishments or 56.9 percent and the remaining 1,112 or 43.1 percent were composed of establishments with total employment of (TE) 20 and over.
For industry groups, support activities for transportation had the highest number of establishment which accounted for nearly half (47.0%) or 1,212 of the total. This was followed by establishments engaged in other land transport with 680 establishments or 26.3 percent while transport via buses ranked third with 256 establishments or 9.9 percent. Figure 1 shows the percentage distribution of establishments by industry group.
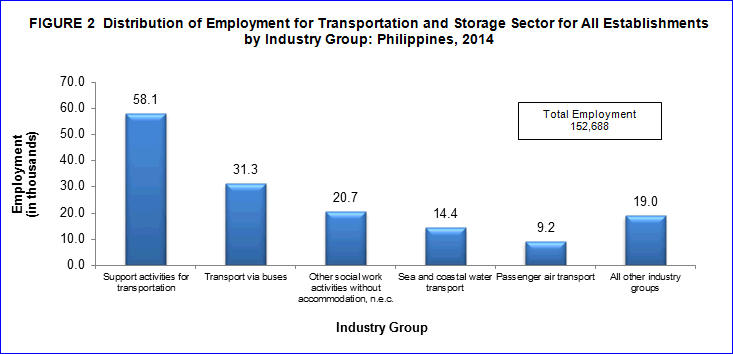
Support activities for transportation employ the highest number of workers
The sector employed a total of 152,688 workers. Of the total, 138,864 or 90.9 percent workers belong to TE of 20 and over while the remaining 13,824 workers were TE of less than 20. About 99.0 percent (151,168) of the total were paid employees and the rest were working owners or unpaid workers.
Figure 2 shows that support activities for transportation hired the most number of employees with 58,101 or 38.1 percent. This was followed by transport via buses providing jobs to 31,255 or 20.5 percent of the total employment. Other land transport came next with 20,668 employees or 13.5 percent.
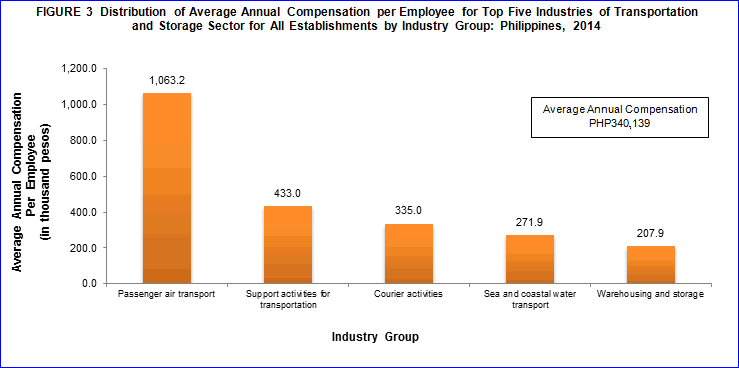
Passenger air transport pays the highest average annual compensation
Total compensation paid by transportation and storage establishments amounted to PHP51.9 billion. About 95.2 percent (PHP49.5 billion) was contributed by establishments with TE of 20 and over while the excess amount of PHP2.5 billion or 4.8 percent paid to establishments with TE of less than 20.
Average annual compensation of the sector was estimated at PHP340.1 thousand per employee. Passenger air transport paid the highest average annual compensation of PHP1.1 million per employee. This was followed by support activities for transportation and courier activities with an average of PHP433.0 and PHP335.0 thousand per employee respectively. Distribution of average annual compensation per employee by industry group is shown in Figure 3.
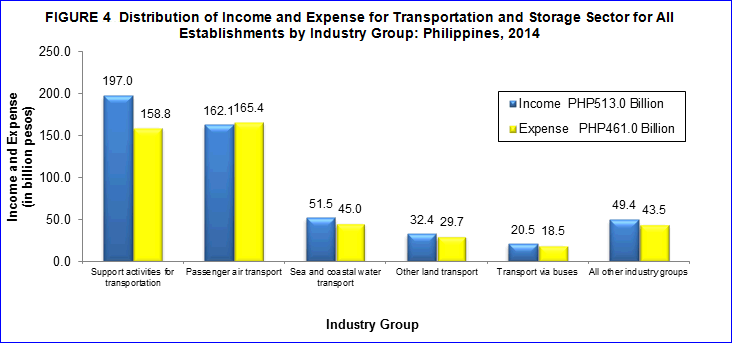
Support activities for transportation earns the biggest share in income
In 2014, total income generated by the sector summed up to PHP513.0 billion. The top income generators were the following: support activities for transportation with PHP197.0 billion (38.4%), passenger air transport with PHP162.1 billion (31.6%), and sea and coastal water transport with PHP51.5 (10.0%).
Total expense including compensation reached PHP461.0 billion. Establishments with TE of 20 and over spent the largest with PHP433.5 billion or 94.0 percent of the total expense. On the other hand, establishments with TE of less than 20 disbursed PHP27.5 billion or 6.0 percent of the total.
Among industry, passenger air transport had the largest proportion in expense with PHP165.4 billion or 35.9 percent. Establishments engaged in support activities for transportation spent PHP158.8 billion or 34.5 percent. Sea and coastal water transport incurred an operating expense of PHP45.0 billion or 9.8 percent. Figure 4 shows the income generated and expense incurred by the transportation and storage establishments by industry group in 2014.
Income - expense ratio stands to 1.11
The sector generated an income per expense ratio of 1.11 for every peso spent. Among industries, both support activities for transportation and warehousing and storage registered the highest income per expense ratio of 1.2, indicating PHP1.2 income per peso expense. While most of the remaining industries recorded the same 1.1 peso income for every peso spent.
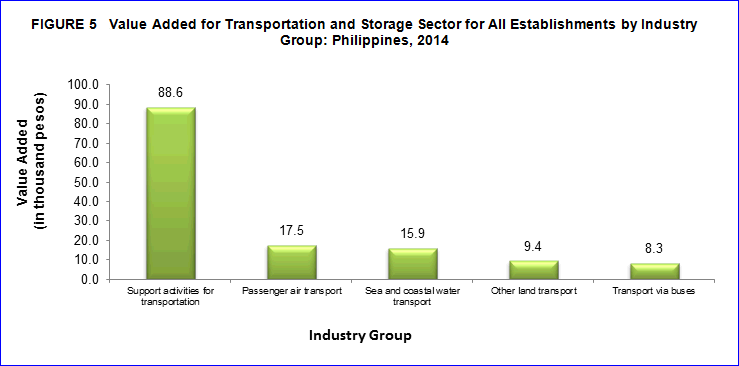
Support activities for transportation accounts for more than 50 percent of total value added
In 2014, value added realized by the sector totaled PHP156.6 billion
Establishments with TE of 20 and over registered a value added of PHP149.6 billion or 95.5 percent of the total for the sector. On the other hand, establishments of TE less than 20 reached value added of PHP7.0 billion or 4.5 percent of the total.
Among industries, support activities for transportation contributed the biggest share to total value added amounting to PHP88.6 billion or 56.6 percent. Passenger air transport came next with PHP17.5 billion or a share of 11.2 percent.
Passenger air transport posts the highest labor productivity
Labor productivity was estimated at PHP1,025.8 million per worker for the sector. The highest labor productivity was recorded by passenger air transport with PHP1,892.9 million per worker. Support activities for transportation placed in second with PHP1,524.7 million per worker. Sea and coastal water transport came third with PHP1,099.9 million per worker. Figure 5 shows the value added per worker by industry group for the transportation and storage sector in 2014.
Gross addition to fixed assets reaches to PHP36.2 billion
Gross additions to tangible fixed assets, which is defined as capital expenditures less sale of fixed assets, acquired by the sector reached to PHP36.2 billion in 2014.
Establishments with TE of 20 and over recorded gross additions to fixed assets at PHP34.9 billion or 96.5 percent of the total while the remaining belongs to establishments with TE of less than 20.
Support activities posted the highest gross additions to fixed assets with PHP16.8 billion or 46.4 percent. Passenger air transport came next with PHP11.3 billion or 31.3 percent. Placed in third was sea and coastal water transport with PHP3.2 billion or 8.9 percent to total gross addition to fixed assets.
Sales from E-commerce totals to PHP25.3 billion
Only establishments engaged in passenger air transport generated sales from e-commerce during the reference year.
TECHNICAL NOTES
Introduction
This Special Release presents the preliminary results of the 2014 Annual Survey of Philippine Business and Industry (ASPBI) for the Transport and Storage sector for all employment sizes in the formal sector of the economy.
The 2014 ASPBI is one of the designated statistical activities of the Philippine Statistics Authority (PSA). Data collected from the survey will provide information on the levels, structure, performance and trends of economic activities of the formal sector of the economy for year 2014. It will also serve as benchmark information in the measurement and comparison of national and regional economic growth.
The survey was conducted nationwide in April 2015 with the year 2014 as the reference period of data, except for employment which is as of November 15, 2014..
Data are presented at the national, regional and industry group or 3-digit 2009 Philippine Standard Industrial Classification (PSIC). .
Data collection was intensified through the use of web-based or online accomplishment of questionnaire through the PSA website and downloading of e-questionnaire and submission thru email.
Legal Authority
The conduct of the 2014 ASPBI is authorized under Republic Act 10625 known as the Philippine Statistical Act of 2013 - Reorganizing and strengthening of the Philippine Statistical System (PSS), its agencies and instrumentalities.
Scope and Coverage
The 2014 ASPBI is a nationwide undertaking confined to the formal sector of the economy and as such excluded the informal sector. The following comprise the formal sector:
- Corporations and partnerships
- Cooperatives and foundations
- Single establishment with employment of 10 or more
- Single proprietorship with branches
Hence, the 2014 ASPBI covered only the following economic units:
- All establishments with total employment (TE) of 10 or more, and;
- All establishments with TE of less than 10, except those establishments with Legal Organization = 1 (single proprietorship) and Economic Organization = 1 (single establishment), that are engaged in economic activities classified according to the 2009 Philippine Standard Industrial Classification (PSIC).
The initial estimate of the 2014 LE shows that there are about 944,500 establishments in operation in the country for the year. About 266,000 establishments (28% of the total establishments) belong to the Formal Sector of which 231,000 (87%) comprise the establishment frame.
Listed below are the 18 economic sectors within the scope of the 2014 ASPBI classified under the 2009 PSIC.
- Agriculture, Forestry and Fishing (A)
- Mining and Quarrying (B)
- Manufacturing (C)
- Electricity, Gas, Steam, and Air Conditioning Supply (D)
- Water Supply; Sewerage, Waste Management and Remediation Activities (E)
- Construction (F)
- Wholesale and Retail Trade; Repair and Maintenance of Motor Vehicles, Motorcycles (G)
- Transportation and Storage (H)
- Accommodation and Food Service Activities (I)
- Information and Communication (J)
- Financial and Insurance Activities (K)
- Real Estate Activities (L)
- Professional, Scientific and Technical Activities (M)
- Administrative and Support Service Activities (N)
- Education (P)
- Human Health and Social Work Activities (Q)
- Arts, Entertainment and Recreation (R)
- Other Service Activities (S)
Sampling Design
Unit of Enumeration
The unit of enumeration for the 2014 ASPBI is the establishment. An establishment is defined as an economic unit, which engages, under a single ownership or control, in one or predominantly one kind of activity at a single fixed physical location.
Classification of Establishments
An establishment is categorized by its economic organization (EO), legal organization (LO), industrial classification, employment size and geographic location.
Economic Organization (EO) refers to the organizational structure or role of the establishment in the organization.
Legal Organization (LO) refers to the legal form of the economic entity that provides the legal basis for ownership of the establishment.
Industrial Classification is determined by the activity from which it derives its major income or revenue. The 2009 PSIC which was approved for adoption by government agencies and instrumentalities through NSCB Resolution No. 2 Series 2010 was utilized to classify economic units according to their economic activities.
Size (SZ) of the Unit of Enumeration is determined by its total employment (TE) as of specific date. Total employment (TE) refers to the total number of persons who work in or for the establishment. This includes paid employees, working owners, unpaid workers and all employees who work full-time or part-time including seasonal workers. Included also are persons on short term leave such as those on sick, vacation or annual leaves and on strike.
Geographic Classification is grouping of establishments by geographic area using the Philippine Standard Geographic Code (PSGC) classification. The PSGC contains the latest updates on the official number of regions, provinces, cities, municipalities, and barangays in the Philippines. The PSGC as of December 31, 2014 was used for the 2014 ASPBI.
Sampling Design
Selection of sample establishment for the 2014 ASPBI was done using stratified systematic sampling with 3-digit or 5-digit PSIC serving as industry strata and employment size as the second stratification variable.
Estimation Procedure
For Establishments with TE of Less Than 20
a. Non-Certainty Stratum
The estimate of the total of a characteristic  for the non-certainty employment stratum TE less than 20 in the sth industry domain was
where:
- s = denotes the non-certainty employment strata in TE of less than 20
- Xsj = value of the jth establishment in non-certainty employment stratum in TE of less than 20 in Sth industry domain
- j = 1,2,3..., ns establishments
- Wsj = weight of the jth establishment in the non-certainty employment stratum of less than 20 in the sth industry domain
- Ns = total number of establishments in the non-certainty employment stratum in TE of less than 20 in the sth industry domain
- ns = number of sample establishments in the non-certainty employment stratum in TE of less than 20 in sth domain
b. Certainty Stratum
The total of a characteristic  for the certainty employment stratum in the Cth industry domain was
where:
- c = denotes the certainty employment strata in TE of less than 20 in the cth industry
- xcj = value of the jth establishment in the certainty employment strata in TE of less than 20 in the cth industry domain
- j = 1,2,3,..., mc establishments
- mc = number of establishments in the certainty employment strata in TE of less than 20 in the cth industry domain
c. Total Estimate for TE of Less Than 20
For all sections except B and C, national level estimates of the total of a characteristic  for the industry domain was obtain by aggregating the estimates for all employment strata (non-certainty and certainty) in the same industry domain,
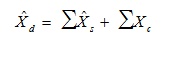
where d denotes the industry domain.
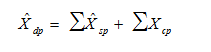
For Establishments with TE of 20 and Over
a. Non-Certainty Stratum (strata of TE 20 to 49 and TE 50 to 99 for Sections G, H, I, J, K, L, M, N, P, Q, R and S.
The estimate of the total of a characteristic ![]() for the non-certainty employment strata in TE of 20 and over for selected industry domain in each region was as
for the non-certainty employment strata in TE of 20 and over for selected industry domain in each region was as
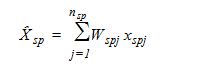
where:
- s = denotes the non-certainty employment strata in TE 20 and over
- p = 1,2,...,17 regions geographic domains
- xspj = value of the jth establishment in the certainty employment strata in TE of 20 and over for an industry domain in each region
- j = 1,2,3..., nsp establishments
- Wspj = weight of the jth establishment in the non-certainty employment strata in TE of 20 and over for an industry domain in each region
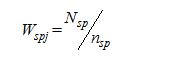
- Nsp = total number of establishments in the non-certainty employment strata in TE of 20 and over for an industry domain in each region
- nsp = number of sample establishments in the non-certainty employment strata in TE of 20 and over for an industry domain in each region
b. Certainty Stratum
The the total of a characteristic  for the certainty employment stratum in TE of 20 and over in an industry domain in each region was
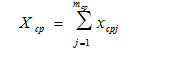
where:
- c = denotes the non-certainty employment strata in TE of 20 and over
- p = 1,2,...17, regions (geographic domains)
- xcpj = value of the jth establishment in the certainty employment strata in TE of 20 and over in an industry domain within each region
- j = 1,2,3..., mcp establishment
- mcp = number of establishments in the certainty strata in TE of 20 and over in an industry domain in each region
c. Total Estimate for TE of 20 and Over
The estimate of the total of a characteristic  for the industry domain in each (geographic domain) was obtained by aggregating the estimates for all employment strata (non-certainty and certainty) in the same industry
where dp denotes the industry domains in each region.
National level estimates of the characteristics by industry domain were obtained by aggregating separately the estimates (Xdp) for the particular industry domain from all the regions.
Weight Adjustment Factor for Non-Response
To account for non-response in the non-certainty strata, the adjustment factor (n/n’) was multiplied with the sampling weight (W) of each of the sampling unit. The sampling weight, defined as N/n, was recomputed as
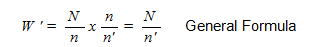
Thus, the adjusted weight (W’sj) for employment stratum in TE 1-9 or TE 10-19 was
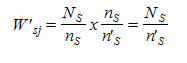
where:
- Ns = total number of establisments in the employment stratum in TE 1-9 or TE 10-19 in the sth industry domain
- n's = number of responding establishments in the employment stratum in TE 1-9 or TE 10-19 in the sth industry domain
For the non-certainty employment stratum for the selected industry domain with TE 20-99, the adjusted weight (W'spj) was
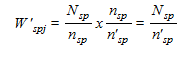
where:
- Nsp = total number of establisments in the non-certainty employment stratum with TE 20-99 for the selected industry domain within each geographic domain (region)
- n'sp = number of responding establishments in the non-certainty employment stratum with TE 20-99 for the selected industry domain within each geographic domain (region)
Questionaire Design
The questionnaire design is basically the same as that of the 2012 Census of Philippine Business and Industry. However, changes were made in the disaggregation of data items for fixed assets in support to the requirements of the 2008 Systems of National Accounts with respect to the generation of fixed capital formation.
The sample establishments responded also to the survey through the use of Web-based version of the 2014 ASPBI questionnaires which was accomplished online at the PSA website. Likewise, an e-questionnaire was also downloaded and submitted thru e-mail.
Response Rate
Field operations of the 2014 ASPBI were scheduled from April to July 2015.
Total response rate for Transport and Storage sector was 93.7 percent (1,048 out of 1,118 establishments). This included receipts of "good" questionnaires, partially accomplished questionnaires, reports of closed, moved out or out of scope establishments.
Of the total responses, nineteen establishments responded online.
Concepts and Definitions of Terms
Establishment is an economic unit under a single ownership control, i.e., under a single entity, engaged in one or predominantly one kind of economic activity at a single fixed location.
Total Employment is the number of persons who worked in for the establishment as of November 15, 2014.
Paid employees are all full-time and part-time employees working in or for the establishment and receiving pay, as well as those working away from the establishment and paid by and under the control of the establishment. Included also are all employees on sick or maternity leave, paid vacation or holiday and on strike. Excluded are directors paid solely for their attendance at meetings, consultants, workers on indefinite leave, working owners who do not receive regular pay, home workers and workers receiving pure commissions only.
Unpaid workers are working owners who do not receive regular pay, apprentices and learners without regular pay and persons working for at least 1/3 of the working time normal to the establishment without regular pay. Excluded are silent or inactive business partners.
Compensation is the sum of salaries and wages, separation, terminal pay and gratuities paid by the establishment to its employees and total employer’s contribution to SSS/GSIS, ECC, PhilHealth, Pag-ibig, etc.
Salaries and wages are payments in cash or in kind to all employees, prior to deductions for employee’s contributions to SSS/GSIS, withholding tax, etc. Included are total basic pay, overtime pay and other benefits.
Income includes cash received and receivables for goods/products and by-products sold and services rendered. Valuation is at producer prices (ex-establishment) net of discounts and allowances, including duties and taxes but excluding subsidies.
Cost refers to all expenses excluding compensation incurred during the year whether paid or payable. Valuation should be at purchaser price including taxes and other charges, net of discounts, rebates, returns and allowances. Goods received from and services rendered by other establishment of the same enterprise are valued as though purchased.
Expense refers to cost incurred by the establishment during the year whether paid or payable. This is treated on a consumed basis. Valuation is at purchaser price including taxes and other charges, net of rebates, returns and allowances. Goods and services received by the establishment from other establishments of the same enterprise are valued as though purchased.
Value Added is gross output less intermediate input. Gross output is equal to the sum of total income (less interest income, rent income from land, dividend income, royalty income and franchise income), capital expenditures of fixed assets produced on own account, and change in inventory. Intermediate input equal to the sum of the following expense items: materials and supplies; fuels, lubricants, oils and greases; electricity and water; industrial services done by others; non-industrial services done by others (less rent expense for land); goods purchased for resale; research and experimental development expense; environmental protection expense; royalty fee; franchise fee and other expense; less change in inventory of materials and supplies; fuels, lubricants, oils and greases; and goods for resale; research and development expense; environmental protection expense; royal fee; franchise fee and other expense.
Gross addition to tangible fixed assets is equal to capital expenditures less sale of fixed assets, including land.
Change in total inventories is computed as the total of ending inventory less the total beginning inventory.
Inventories refer to the stock of goods owned by and under the control of the establishment as of a fixed date, regardless of where the stocks are located. Valuation is at current replacement cost in purchaser prices. Replacement cost is the cost of an item in terms of its present price rather than its original cost.
E-Commerce refers to the selling of products or services over electronic systems such as the Internet Protocol-based networks and other computer networks, Electronic Data Interchange (EDI) network, or other on-line system.