
Retail sale of other goods in specialized store accounts for majority of establishments
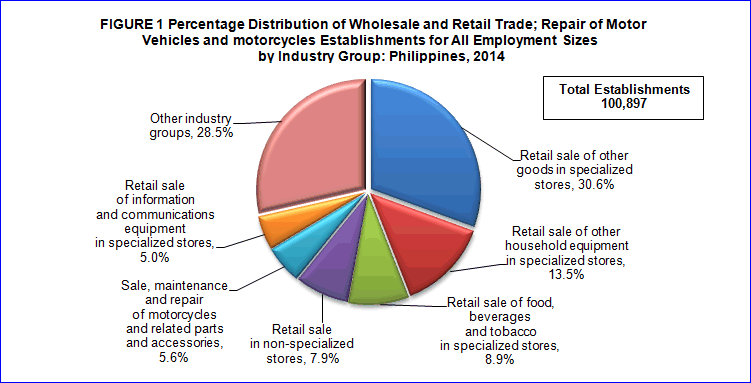
Final results of the 2014 Annual Survey of Philippine Business and Industry posted 100,897 total establishments that were engaged in wholesale and retail trade; repair of motor vehicles and motorcycles, nationwide. The total is composed of establishments with total employment (TE) of 20 and over (8,600 or 8.5%) and establishments with TE of less than 20 (92,297 or 91.5%).
The highest number of establishments was retail sale of other goods in specialized stores (30,851 or 30.6 %) and this was followed by establishments engaged in retail sale of other household equipment in specialized store with 13,593 (13.5%). Establishments engaged in retail sale of food, beverages and tobacco in specialized stores came in third with 8,932 or 8.9 percent. Figure 1 shows the percentage distribution below.
Retail sale of other goods in specialized stores hire the highest number of workers
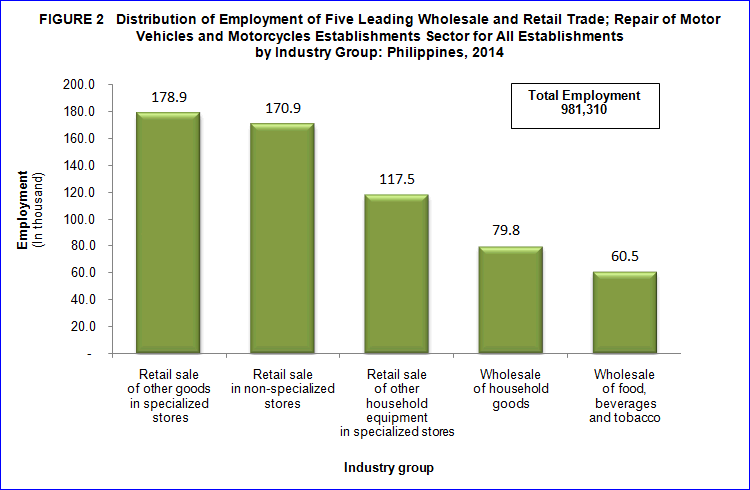
In 2014, the total employment of the sector was estimated to be 981,310. Paid workers were counted up to 970,473 (98.9%) and the rest were working owners and unpaid workers. About 47.0 percent (460,882) of the total employees worked for establishments with TE of 20 and over and the 53.0 percent (520,427) remaining worked for establishments with TE of less than 20.
The top three retail establishments provided employment to almost half (47.6%) or 467,273 workers to the total labor force of the sector. These were retail sale of other goods in specialized stores with 178,888 (18.2%); retail sale in non-specialized stores with 170,899 (17.4%); and retail sale of other household equipment in specialized stores with 117,486 (12.0%). The non-specialized wholesale trade had the lowest number with 1,065 employees.
The average number of workers per establishment of the sector was recorded at 10 employees. Sale of motor vehicles recorded the highest at 25 employees, followed by wholesale of food, beverages and tobacco; wholesale of machinery, equipment and supplies; and retail sale in non-specialized stores at 21 employees a piece. Wholesale of household goods came as third posting an average of 20 employees per establishment. Figure 2 exhibit the distribution of employment of five industries.
Total compensation builds up to PHP142.6 billion
Total compensation paid by the sector to employees reached PHP142.6 billion in 2014, equivalent to an average annual compensation of PHP147.0 thousand per employee. For the establishment with TE 20 and over, the total compensation reached PHP81.6 billion (51.2%). On the other hand, establishment with TE of less than 20 paid only PHP61.1 billion (42.8%).
By industry group, retail sale of other goods in specialized stores paid the highest compensation expenditures amounting to PHP25.2 billion or 17.7 percent of the total. Retail sale in non-specialized stores was second with PHP22.2 billion or 15.6 percent. Wholesale of household goods came in third with PHP18.5 billion (13.0%). Non-specialized wholesale trade recorded the lowest payment at PHP193.1 million (0.1%).
Workers of wholesale of household goods are highest-paid employees in 2014
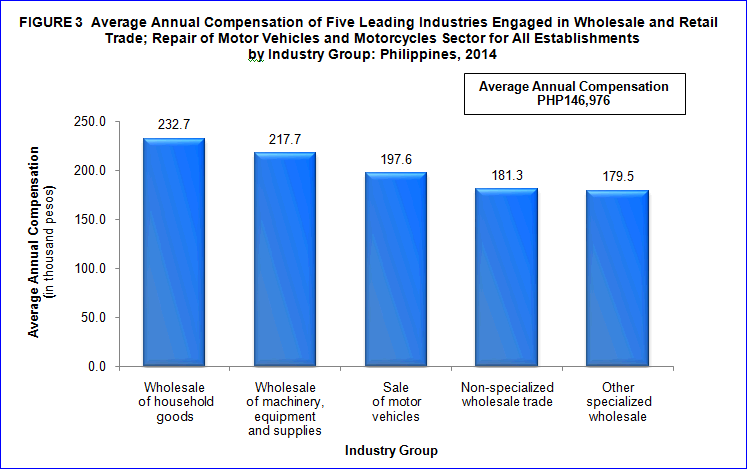
Workers in wholesale of household goods received the highest average annual compensation of PHP232.7 thousand or an average monthly compensation of PHP19,392. On the other hand, workers employed in wholesale of agricultural raw materials and live animals received the lowest average annual compensation of PHP91.6 thousand or monthly compensation of PHP7,637. Figure 3 presents average annual compensation of employees of five industries.
Retail sale in non-specialized stores contribute the largest share in income and expense
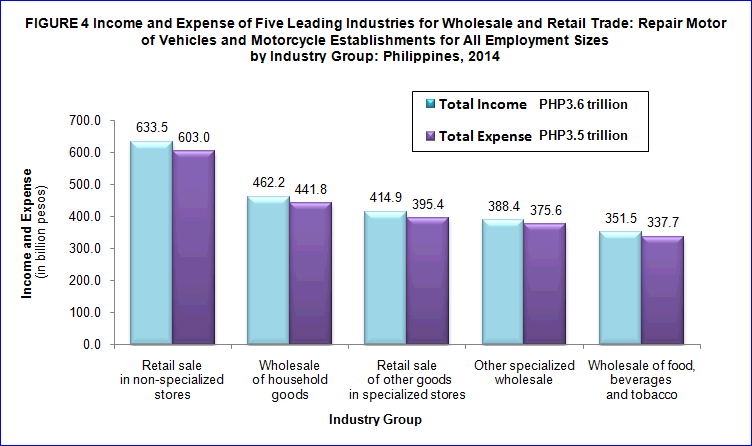
The sector generated a total income amounting to PHP3.6 trillion and incurred a total expense valued at PHP3.5 trillion in 2014. More than two-thirds or 68.0 percent of the total income as well as the total expense was contributed by establishments with TE of 20 and over.
Retail sale in non-specialized stores earned the highest income of PHP633.5 billion (17.4%), followed by wholesale of household goods with PHP462.2 billion (12.7%). Retail sale of other goods in specialized stores ranked third with PHP414.9 billion (11.4%) return. In contrast, non-specialized wholesale trade made the lowest earnings of PHP2.4 billion.
Likewise, retail sale in non-specialized stores had incurred the largest expenditures at PHP603.0 billion (17.3%). Wholesale of household goods and retail sale of other goods in specialized store spent PHP441.8 billion (12.7%) and PHP395.4 billion (11.4%) overheads respectively. On the other hand, non-specialized wholesale trade incurred the lowest expense of PHP2.2 billion. Figure 4 below shows the top five industry groups in terms of income and expense.
Income-expense ratio equivalent to 1.05
The income per peso expense yielded an average ratio of 1.05 in 2014. Wholesale on a fee or contract basis produced the highest average with 1.11 among industries. Sale, maintenance and repair of motorcycles and related parts and accessories trailed with 1.09. Concurrently wholesale of machinery, equipment and supplies; and non-specialized wholesale trade have 1.07 income-expense ratio. On the other hand, industry engaged in retail sale of automotive fuel in specialized stores recorded the lowest ratio of 1.02.
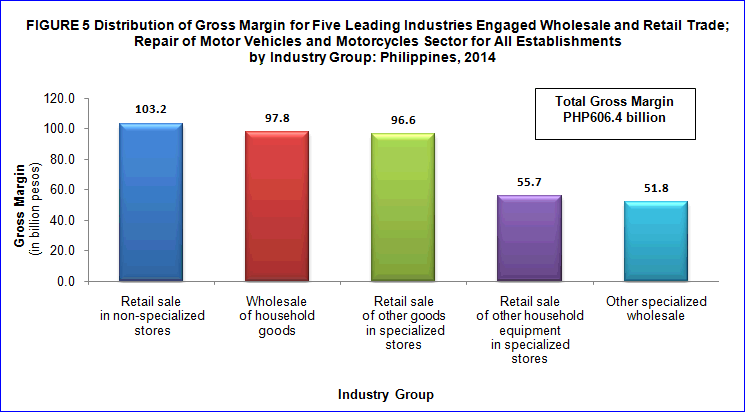
Gross margin reaches PHP606.4 billion
Gross margin or trade margin of the sector amounted to PHP606.4 billion in 2014. Retail sale in non-specialized stores attained an output valued at PHP103.2 billion (17.0%), wholesale of household goods with PHP97.8 billion (16.1%), and retail sale of other goods in specialized stores with PHP96.6 billion (15.9%). Maintenance and repair of motor vehicles produced the lowest output only at PHP158.0 million (0.02%). Figure 5 exhibit the values of gross margin of five industries.
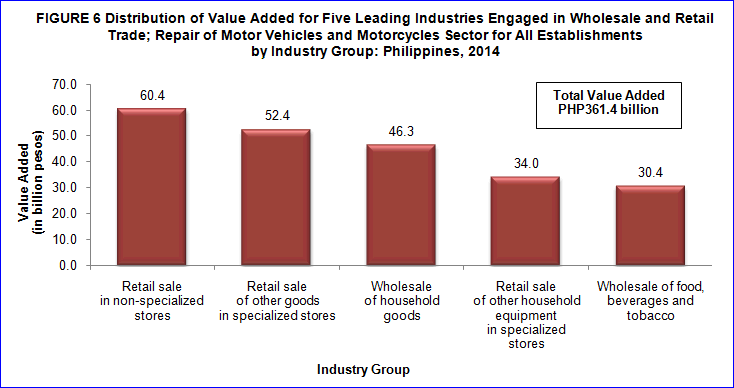
Value Added amounts to PHP361.4 billion
Value Added generated by wholesale and retail trade; repair of motor vehicles and motorcycles sector was estimated at PHP361.4 billion in 2014.
Top three industries produced nearly half (44.0%) the total value added of the sector. These were the following namely: retail sale in non-specialized stores with PHP60.4 billion (16.7%), retail sale of other goods in specialized stores with PHP52.4 billion (14.5%) and wholesale of household goods with PHP46.3 billion (12.8%). Figure 6 presents the distribution of value added of five industries.
Other specialized wholesale industry has the highest labor productivity
Value added per employee (a measure the labor productivity of the sector) was estimated at PHP368.3 thousand. Other specialized wholesale industry recorded the highest among industries, with PHP617.5 thousand while maintenance and repair of motor vehicles generated the lowest with PHP184.3 thousand.
Gross additions to fixed assets mount up to PHP26.2 billion
Acquisition of fixed assets (capital expenditures less sale of fixed assets) by the sector, increased to PHP26.2 billion in 2014. Retail sale in non-specialized stores acquired the biggest gross addition to fixed assets with PHP5.0 billion (19.2%) while retail trade not in stores, stalls or markets had the least with PHP4.3 million.
Total change in inventories amount to PHP52.1 billion
Total change in inventories (ending less beginning inventory) of the sector was recorded at PHP52.1 billion in 2014. Wholesale of food, beverages and tobacco had the highest value of stocks amounting to PHP9.6 billion (18.3%). Retail sale in non-specialized stores with PHP9.0 billion (17.1%) and wholesale of household goods with PHP8.1 billion (15.5%), followed respectively.
Government grants PHP4.7 billion subsidies
The government has given subsidies in terms of financial assistance or tax exemption amounting to PHP4.7 billion in 2014 and the following industries that recorded subsidies were:
- Wholesale of food, beverages and tobacco industry, PHP4.4 billion;
- Retail sale in non-specialized stores, PHP358.0 million; and
- Retail sale of other goods in specialized stores, PHP13.8 million.
Sales from E-commerce reach PHP1.9 billion
Sales from e-commerce transactions of the sector reached PHP1.9 billion. Three industries of the sector posted the highest e-commerce transactions namely:
- Wholesale of household goods, PHP642.3 million (34.7%);
- Retail sale of other goods in specialized stores,PHP396.2 million (21.4%); and
- Retail trade not in stores, stalls or markets, PHP306.1 million (16.5%).
TECHNICAL NOTES
Introduction
This Special Release presents the final results of the 2014 Annual Survey of Philippine Business and Industry (ASPBI) for the Wholesale and Retail Trade; Repair of Motor Vehicles and Motorcycles sector for all establishments in the formal sector of the economy.
The 2014 ASPBI is one of the designated statistical activities of the Philippine Statistics Authority (PSA). Data collected from the survey will provide information on the levels, structure, performance and trends of economic activities of the formal sector of the economy for year 2014. It will also serve as benchmark information in the measurement and comparison of national and regional economic growth.
The survey was conducted nationwide in April 2015 with the year 2014 as the reference period of data, except for employment which is as of November 15, 2014.
Data are presented at the national, regional and industry group or 3-digit 2009 Philippine Standard Industrial Classification (PSIC).
Data collection was intensified through the use of web-based or online accomplishment of questionnaire through the PSA website and downloading of e-questionaire and submission thru email.
Legal Authority
The conduct of the 2014 ASPBI is authorized under Republic Act 10625 known as the Philippine Statistical Act of 2013 - Reorganizing and strengthening of the Philippine Statistical System (PSS), its agencies and instrumentalities.
Scope and Coverage
The 2014 ASPBI is a nationwide undertaking confined to the formal sector of the economy and as such excluded the informal sector. The following comprise the formal sector:
- Corporations and partnerships
- Cooperatives and foundations
- Single establishment with employment of 10 or more
- Single proprietorship with branches
Hence, the 2014 ASPBI covered only the following economic units:
- All establishments with total employment (TE) of 10 or more, and;
- All establishments with TE of less than 10, except those establishments with Legal Organization = 1 (single proprietorship) and Economic Organization = 1 (single establishment), that are engaged in economic activities classified according to the 2009 Philippine Standard Industrial Classification (PSIC).
The initial estimate of the 2014 LE shows that there are about 944,500 establishments in operation in the country for the year. About 266,000 establishments (28% of the total establishments) belong to the Formal Sector of which 231,000 (87%) comprise the establishment frame.
Listed below are the 18 economic sectors within the scope of the 2014 ASPBI classified under the 2009 PSIC.
- Agriculture, Forestry and Fishing (A)
- Mining and Quarrying (B)
- Manufacturing (C)
- Electricity, Gas, Steam, and Air Conditioning Supply (D)
- Water Supply; Sewerage, Waste Management and Remediation Activities (E)
- Construction (F)
- Wholesale and Retail Trade; Repair and Maintenance of Motor Vehicles, Motorcycles (G)
- Transportation and Storage (H)
- Accommodation and Food Service Activities (I)
- Information and Communication (J)
- Financial and Insurance Activities (K)
- Real Estate Activities (L)
- Professional, Scientific and Technical Activities (M)
- Administrative and Support Service Activities (N)
- Education (P)
- Human Health and Social Work Activities (Q)
- Arts, Entertainment and Recreation (R)
- Other Service Activities (S)
Sampling Design
Unit of Enumeration
The unit of enumeration for the 2014 ASPBI is the establishment. An establishment is defined as an economic unit, which engages, under a single ownership or control, in one or predominantly one kind of activity at a single fixed physical location.
Classification of Establishments
An establishment is categorized by its economic organization (EO), legal organization (LO), industrial classification, employment size and geographic location.
Economic Organization (EO). This refers to the organizational structure or role of the establishment in the organization.
Legal Organization (LO). This refers to the legal form of the economic entity that provides the legal basis for ownership of the establishment. The following are the types of legal organization:
Industrial Classification. The Industrial Classification of an economic unit is determined by the activity from which it derives its major income or revenue. The 2009 PSIC which was approved for adoption by government agencies and instrumentalities through NSCB Resolution No. 2 Series 2010 was utilized to classify economic units according to their economic activities.
Size (SZ) of the Unit of Enumeration. The size of economic unit is determined by its total employment (TE) as of specific date. Total employment (TE) refers to the total number of persons who work in or for the establishment. This includes paid employees, working owners, unpaid workers and all employees who work full-time or part-time including seasonal workers. Included also are persons on short term leave such as those on sick, vacation or annual leaves and on strike.
Geographic Classification is grouping of establishments by geographic area using the Philippine Standard Geographic Code (PSGC) classification. The PSGC contains the latest updates on the official number of regions, provinces, cities, municipalities, and barangays in the Philippines. The PSGC as of December 31, 2014 was used for the 2014 ASPBI.
Sampling Design
Selection of sample establishment for the 2014 ASPBI was done using stratified systematic sampling with 3-digit or 5-digit PSIC serving as industry strata and employment size as the second stratification variable.
Estimation Procedure
For Establishments with TE of Less Than 20
a. Non-Certainty Stratum
The estimate of the total of a characteristic  for the non-certainty employment stratum TE less than 20 in the sth industry domain was
where:
- s = denotes the non-certainty employment strata in TE of less than 20
- Xsj = value of the jth establishment in non-certainty employment stratum in TE of less than 20 in Sth industry domain
- j = 1,2,3..., ns establishments
- Wsj = weight of the jth establishment in the non-certainty employment stratum of less than 20 in the sth industry domain
- Ns = total number of establishments in the non-certainty employment stratum in TE of less than 20 in the sth industry domain
- ns = number of sample establishments in the non-certainty employment stratum in TE of less than 20 in sth domain
b. Certainty Stratum
The total of a characteristic  for the certainty employment stratum in the Cth industry domain was
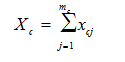
where:
- c = denotes the certainty employment strata in TE of less than 20 in the cth industry
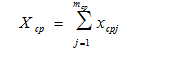
- xcj = value of the jth establishment in the certainty employment strata in TE of less than 20 in the cth industry domain
- j = 1,2,3,..., mc establishments
- mc = number of establishments in the certainty employment strata in TE of less than 20 in the cth industry domain
c. Total Estimate for TE of Less Than 20
For all sections except B and C, national level estimates of the total of a characteristic  for the industry domain was obtain by aggregating the estimates for all employment strata (non-certainty and certainty) in the same industry domain,
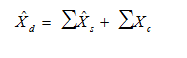
where d denotes the industry domain.
For Establishments with TE of 20 and Over
a. Non-Certainty Stratum (strata of TE 20 to 49 and TE 50 to 99 for Sections G, H, I, J, K, L, M, N, P, Q, R and S.
The estimate of the total of a characteristic ![]() for the non-certainty employment strata in TE of 20 and over for selected industry domain in each region was as
for the non-certainty employment strata in TE of 20 and over for selected industry domain in each region was as
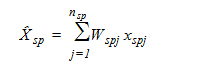
where:
- s = denotes the non-certainty employment strata in TE 20 and over
- p = 1,2,...,17 regions geographic domains
- xspj = value of the jth establishment in the certainty employment strata in TE of 20 and over for an industry domain in each region
- j = 1,2,3..., nsp establishments
- Wspj = weight of the jth establishment in the non-certainty employment strata in TE of 20 and over for an industry domain in each region
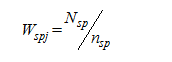
- Nsp = total number of establishments in the non-certainty employment strata in TE of 20 and over for an industry domain in each region
- nsp = number of sample establishments in the non-certainty employment strata in TE of 20 and over for an industry domain in each region
b. Certainty Stratum
The the total of a characteristic  for the certainty employment stratum in TE of 20 and over in an industry domain in each region was
where:
- c = denotes the non-certainty employment strata in TE of 20 and over
- p = 1,2,...17, regions (geographic domains)
- xcpj = value of the jth establishment in the certainty employment strata in TE of 20 and over in an industry domain within each region
- j = 1,2,3..., mcp establishment
- mcp = number of establishments in the certainty strata in TE of 20 and over in an industry domain in each region
c. Total Estimate for TE of 20 and Over
The estimate of the total of a characteristic  for the industry domain in each (geographic domain) was obtained by aggregating the estimates for all employment strata (non-certainty and certainty) in the same industry
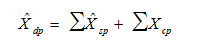
where dp denotes the industry domains in each region.
National level estimates of the characteristics by industry domain were obtained by aggregating separately the estimates (Xdp) for the particular industry domain from all the regions.
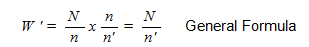
Weight Adjustment Factor for Non-Response
To account for non-response in the non-certainty strata, the adjustment factor (n/n’) was multiplied with the sampling weight (W) of each of the sampling unit. The sampling weight, defined as N/n, was recomputed as
Thus, the adjusted weight (W’sj) for employment stratum in TE 1-9 or TE 10-19 was
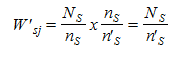
where:
- Ns = total number of establisments in the employment stratum in TE 1-9 or TE 10-19 in the sth industry domain
- n's = number of responding establishments in the employment stratum in TE 1-9 or TE 10-19 in the sth industry domain
For the non-certainty employment stratum for the selected industry domain with TE 20-99, the adjusted weight (W'spj) was
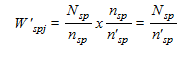
where:
- Nsp = total number of establisments in the non-certainty employment stratum with TE 20-99 for the selected industry domain within each geographic domain (region)
- n'sp = number of responding establishments in the non-certainty employment stratum with TE 20-99 for the selected industry domain within each geographic domain (region)
Questionaire Design
The questionnaire design is basically the same as that of the 2012 Census of Philippine Business and Industry. However, changes were made in the disaggregation of data items for fixed assets in support to the requirements of the 2008 Systems of National Accounts with respect to the generation of fixed capital formation.
The sample establishments responded also to the survey through the use of Web-based version of the 2014 ASPBI questionnaires which was accomplished online at the PSA website. Likewise, an e-questionnaire was also downloaded and submitted thru e-mail.
Response Rate
Field operations of the 2014 ASPBI were scheduled from April to July 2015.
Total response rate for Wholesale and retail trade; repair of motor vehicles and motorcycles sector was 86.5 percent (5,867 out of 6,785 establishments). This included receipts of "good" questionnaires, partially accomplished questionnaires, reports of closed, moved out or out of scope establishments.
Of the total responses, 117 establishments responded online
Concepts and Definitions of Terms
Establishment is an economic unit under a single ownership control, i.e., under a single entity, engaged in one or predominantly one kind of economic activity at a single fixed location.
Total Employment is the number of persons who worked in for the establishment as of November 15, 2014.
Paid employees are all full-time and part-time employees working in or for the establishment and receiving pay, as well as those working away from the establishment and paid by and under the control of the establishment. Included also are all employees on sick or maternity leave, paid vacation or holiday and on strike. Excluded are directors paid solely for their attendance at meetings, consultants, workers on indefinite leave, working owners who do not receive regular pay, home workers and workers receiving pure commissions only.
Unpaid workers are working owners who do not receive regular pay, apprentices and learners without regular pay and persons working for at least 1/3 of the working time normal to the establishment without regular pay. Excluded are silent or inactive business partners.
Compensation is the sum of salaries and wages, separation, terminal pay and gratuities paid by the establishment to its employees and total employer’s contribution to SSS/GSIS, ECC, PhilHealth, Pag-ibig, etc.
Salaries and wages are payments in cash or in kind to all employees, prior to deductions for employee’s contributions to SSS/GSIS, withholding tax, etc. Included are total basic pay, overtime pay and other benefits.
Income or Revenue includes cash received and receivables for goods/products and by-products sold and services rendered. Valuation is at producer prices (ex-establishment) net of discounts and allowances, including duties and taxes but excluding subsidies.
Cost refers to all expenses incurred during the year whether paid or payable. Valuation is at purchaser prices including taxes and other charges, net of rebates, returns and allowances. Goods and services received by the establishment from other establishments of the same enterprise are valued as though purchased.
Expense refers to cost incurred by the establishment during the year whether paid or payable. This is treated on a consumed basis. Valuation is at purchaser price including taxes and other charges, net of rebates, returns and allowances. Goods and services received by the establishment from other establishments of the same enterprise are valued as though purchased.
Value Added is gross output less intermediate input. Gross output for Wholesale and retail trade; repair of motor vehicles and motorcycles is the sum of the total income (less rent income from land, royalty income and franchise income), capital expenditures of fixed assets produced on own account and change in inventories. Intermediate input is equal to the sum of the following cost items: materials and supplies purchased; fuels, lubricants, oils and greases purchased; electricity purchased, water purchased; industrial services done by others; non-industrial services done by others; goods purchased for resale; research and development expense; environmental protection expense; royalty fee; franchise fee and other expenses.
Gross addition to tangible fixed assets is equal to capital expenditures less sale of fixed assets, including land.
Change in total inventories is computed as the total of ending inventory less the total beginning inventory.
Inventories refer to the stock of goods owned by and under the control of the establishment as of a fixed date, regardless of where the stocks are located. Valuation is at current replacement cost in purchaser prices. Replacement cost is the cost of an item in terms of its present price rather than its original cost.
E-Commerce refers to the selling of products or services over electronic systems such as the Internet Protocol-based networks and other computer networks, Electronic Data Interchange (EDI) network, or other on-line system.