
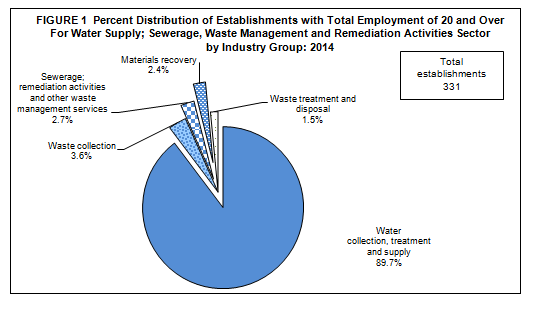
Water collection, treatment and supply records the highest number of establishments
The 2014 Annual Survey of Philippine Business and Industry (ASPBI) conducted nationwide covered a total of 331 establishments with total employment (TE) of 20 and over engaged in water supply; sewerage, waste management and remediation activities.
Among the industries, water collection, treatment and supply led the sector with 297 establishments accounting for 89.7 percent of the total. This was followed distantly by waste collection with 12 establishments or 3.6 percent of the total count. Figure 1 shows the distribution of establishments with TE of 20 and over for water supply; sewerage, waste management and remediation activities sector by industry group in 2014.
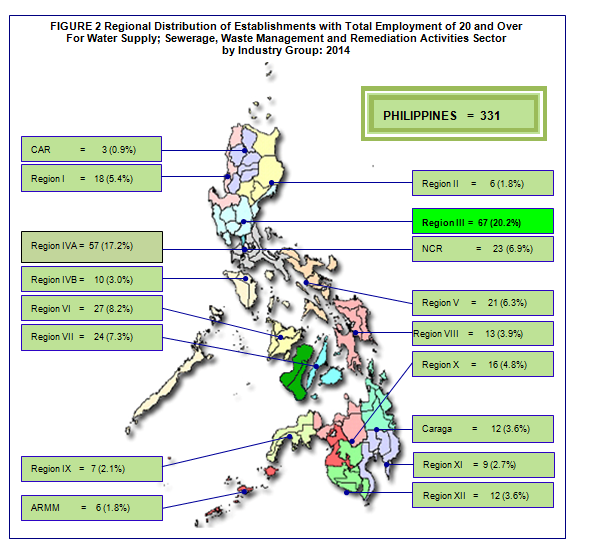
The top three regions, in terms of number of establishments, comprised 45.6 percent of the total. These were Central Luzon (Region III) with 67 (20.2%), CALABARZON (Region IV-A) with 57 (17.2%) and Western Visayas (Region VI) with 27 (8.2%). On the other hand, Cordillera Administrative Region (CAR) recorded the least count with only 3 establishments (0.9%). Figure 2 illustrates the regional distribution of establishments with TE of 20 and over for water supply; sewerage, waste management and remediation activities sector by industry group in 2014.
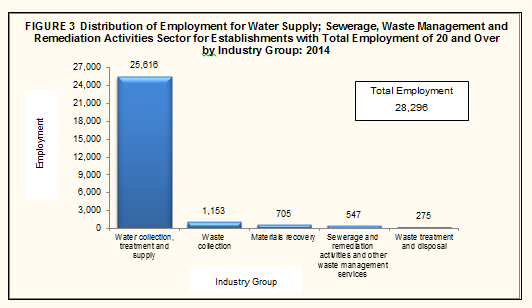
Water collection, treatment and supply employs 28,296 workers
Total employment generated by establishments with TE of 20 and over reached 28,296 in 2014. Of the total workforce, 28,145 workers (99.5%) were paid employees and the rest were working owners and unpaid workers.
By industry group, water collection, treatment and supply, recording the most number of establishments, was also the top employer with 25,616 workers or 90.5 percent of the total. Waste collection ranked a far second with 1,153 workers (4.1%), followed by materials recovery with only 705 workers (2.5%). Figure 3 shows the distribution of employment for water supply; sewerage, waste management and remediation activities sector for establishments with TE of 20 and over by industry group in 2014.
Among the regions, National Capital Region (NCR) employed the highest number of workers with 5,069 or 17.9 percent of the total, followed by Central Luzon with 4,777 (16.9%) workers. Completing the op three regions with most number of workers is CALABARZON with 4,525 (16.0%).
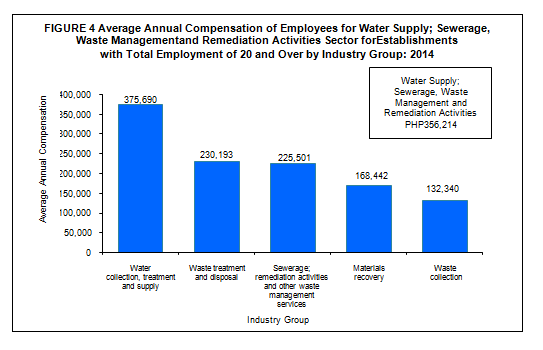
Employees of water collection, treatment and supply are the highest paid
Total compensation paid in 2014 by establishments with TE of 20 and over, amounted to PHP10.0 billion, translating to an average annual compensation of PHP 356,214 per employee.
Employees working in water collection, treatment and supply were the highest paid receiving an average annual compensation of PHP375,690. This was followed by employees working in waste treatment and disposal with average annual pay of PHP230,193, and sewerage; remediation activities and other waste management services at PHP225,501 per employee. On the other hand, employees in waste collection received the lowest annual pay of PHP132,340 per employee. Figure 4 shows the average annual compensation of employees for water supply; sewerage, waste management and remediation activities sector for establishments with TE of 20 and over by industry group in 2014.
At the regional level, employees in NCR received the highest average annual pay of PHP716,633, followed by employees in Davao Region and CAR receiving an average annual compensation of PHP330,422 and PHP325,780, respectively. Whereas, employees in Autonomous Region in Muslim Mindanao (ARMM) received the lowest average annual compensation of PHP136,007.
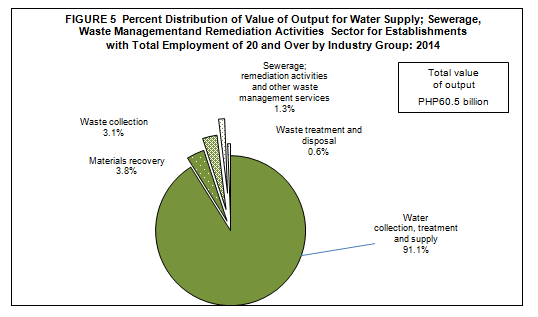
Value of output of the sector reaches PHP60.5 billion
Total value of output generated by establishments with TE of 20 and overwas estimated at PHP60.5 billion.
Water collection, treatment and supply which produced the highest output value of PHP55.1 billion accounted for the lion’s share at 91.1 percent of the total. The shares of other industries to the total value of output are as follows:
- Materials recovery, PHP2.3 billion (3.8%)
- Waste collection, PHP1.9 billion (3.1%)
- Sewerage, and remediation activities and other waste management services, PHP0.8 billion (1.3%)
- Waste treatment and disposal, PHP0.4 billion (0.6%)
Figure 5 shows the distribution of value of output for water supply; sewerage, waste management and remediation activities sector for establishments with TE of 20 and over by industry group in 2014.
Among regions, NCR shared the biggest output value estimated at PHP31.8 billion or more than half (52.6%) of the total value of output. This was distantly followed by Central Luzon and CALABARZON with respective output value of PHP7.7 billion and PHP6.3 billion.
Total expense of the sector amounts to PHP52.1 billion
Total expense, including compensation, amounted to PHP52.1 billion in 2014.
Among industries, water collection, treatment and supply incurred the highest expense amounting to PHP47.6 billion or 91.4 percent of the total. Waste collection and materials recovery followed next with PHP2.2 billion (4.3%) and PHP1.2 billion (2.3%), respectively.
At the regional level, more than half (55.6%) or PHP28.9 billion was incurred by establishments located in NCR, the highest among the regions. Central Luzon and CALABARZON ranked a far second and third spending PHP6.2 billion (11.8%) and PHP4.9 billion (9.3%), respectively.
Water collection, treatment and supply records the highest returns
Income per expense ratio for establishments with TE of 20 and over in 2014 was recorded at 1.43, indicating that for every peso spent PHP1.43 was realized in terms of income.
Industries that surpassed the sector’s income per expense ratio were materials recovery and waste treatment and disposal with respective income-expense ratio of 1.92 and 1.65. The income-expense ratio of other industries are as follows:
- Water collection, treatment and supply (1.43)
- Waste collection (1.17)
- Sewerage; remediation activities and other waste management services (1.15)
Among regions, MIMAROPA registered the highest return at 1.52. Davao Region and NCR placed second and third with 1.46 and 1.43 income per peso expense, respectively.
Value Added of the sector stands at PHP40.3 billion
Value added generated by establishments with TE of 20 and over reached PHP40.3 billion in 2014.
Among industries, water collection, treatment and supply contributed the biggest share to value added amounting to PHP38.2 billion or 94.7 percent of the total. Materials recovery ranked a far second with PHP1.3 billion (3.1%), followed by waste collection with PHP0.5 billion (1.1%).
At the regional level, NCR led the regions in terms of value added, generating PHP23.6 billion or more than half (58.5%) of the total. This was followed by Central Luzon and CALABARZON with respective shares of PHP4.0billion (10.0%) and PHP3.5 billion (8.6%).
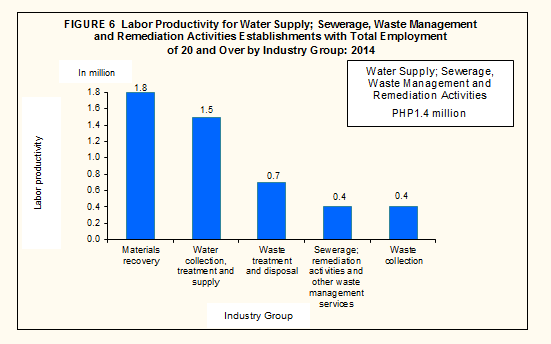
Labor productivity of the sector is PHP1.4 million per worker
The ratio of value added per worker, a measure of labor productivity, was estimated at PHP1.4 million for establishments with TE of 20 and over.
The highest labor productivity was recorded by materials recovery valued at PHP1.8 million per worker, followed by water collection, treatment and supplywith PHP1.5 million per worker. Labor productivity of other industries are as follows:
- Waste treatment and disposal(PHP0.7 million per worker)
- Sewerage; remediation activities and other waste management services (PHP0.4 million per worker)
- Waste collection (PHP0.4 million per worker)
Figure 6 shows the labor productivity for water supply; sewerage, waste management and remediation activities sector for establishments with TE of 20 and over by industry group in 2014.
Among regions, workers in NCR were the most productive generating PHP4.7 million per worker. This was distantly followed by workers in Davao Region and MIMAROPA with respective productivity of PHP927.4 thousand and PHP854.2 thousand per worker.
Gross Addition to Tangible Fixed Assets of the sector amounts to PHP3.5 billion
Gross addition to tangible fixed assets, defined as capital expenditures less sale of fixed assets, was valued at PHP3.5 billion for establishments with TE of 20 and over.
Water collection, treatment and supply acquired PHP3.5 billion or 98.5 percent of the total. Gross addition to fixed assets of other industries are as follows:
- Waste treatment and disposal (PHP47.3 million)
- Sewerage; remediation activities and other waste management services (PHP4.2 million)
- Waste collection (PHP0.7 million)
- Materials recovery (PHP0.1 million)
Subsidies received by the sector amount to PHP31.2 million
Total subsidies provided by the government to support the business operation of establishments with TE of 20 and over amounted to PHP31.2 million.
Water collection, treatment and supply industry was the only recipient of subsidies in 2014.
TECHNICAL NOTES
Introduction
This Special Release presents the preliminary results of the 2014ASPBI for the Water Supply; Sewerage, Waste Management and Remediation Activitiessector for establishments with total employment of 20 and over.
The 2014 ASPBI is one of the designated statistical activities of the Philippine Statistics Authority (PSA). Data collected from the survey provide information on the levels, structure, performance, and trends of economic activities of the formal sector in the entire country for the year 2014. The 2014 Survey of Tourism Establishments in the Philippines was undertaken as a rider to this survey.
The survey was conducted nationwide in 2015 with the year 2014 as the reference period of data, except for employment which is as of November 15, 2014.
Data are presented at the national and industry sub-class or 3-digit 2009 Philippine Standard Industrial Classification (PSIC).
Legal Authority
The conduct of the 2014 ASPBI is authorized under Republic Act 10625 known as the Philippine Statistical Act of 2013 - Reorganizing and strengthening of the Philippine Statistical System (PSS), its agencies and instrumentalities.
Scope and Coverage
The 2014 ASPBI covered establishments engaged in 18 economic sectors classified under the 2009 PSIC, namely:
- Agriculture, Forestry and Fishing (A)
- Mining and Quarrying (B)
- Manufacturing (C)
- Electricity, Gas, Steam, and Air Conditioning Supply (D)
- Water Supply; Sewerage, Waste Management and Remediation Activities (E)
- Construction (F)
- Wholesale and Retail Trade; Repair and Maintenance of Motor Vehicles, Motorcycles (G)
- Transportation and Storage (H)
- Accommodation and Food Service Activities (I)
- Information and Communication (J)
- Financial and Insurance Activities (K)
- Real Estate Activities (L)
- Professional, Scientific and Technical Activities (M)
- Administrative and Support Service Activities (N)
- Education (P)
- Human Health and Social Activities (Q)
- Arts, Entertainment and Recreation (R)
- Other Service Activities (S)
The survey was confined to the formal sector of the economy, which consists of the following:
- Corporations and partnership
- Cooperatives and foundations
- Single proprietorship with employment of 10 and over
- Single proprietorships with branches
Hence, the 2014 ASPBI covered only the following economic units:
- All establishments with total employment (TE) of 10 and over, and;
- All establishments with TE of less than 10, except those establishments with Legal Organization = 1 (single proprietorship) and Economic Organization = 1 (single establishment), that are engaged in economic activities classified according to the 2009 Philippine Standard Industrial Classification (PSIC).
Frame of Establishments
The frame for the 2014 ASPBI was extracted from the 2014 List of Establishments (LE). The estimated number of establishments in operation in the country in 2014was 944,500. About 266,257 establishments (28.0%) of the total establishments) belong to the formal sector of which 231,241 (87.0%) comprised the establishment frame. This frame was used to draw the sample establishments for the survey.
Unit of Enumeration
The unit of enumeration for the 2014 ASPBI is the establishment. Anestablishment is defined as an economic unit under a single ownership or control which engages in one or predominantly one kind of activity at a single fixed location.
Classification of Establishments
An establishmentis categorized by its economic organization, legal organization, industrial classification, employment size, and geographic location.
Economic Organization refers to the organizational structure or role of the establishment in the organization. An establishment may be single establishment, branch, establishment and main office with branches elsewhere, main office only, and ancillary unit other than main office.
Legal Organization refers to the legal form of the economic entity which owns the establishment. An establishment may be single proprietorship, partnership, government corporation, stock corporation, non-stock corporation, and cooperative.
Industrial classification of an economic unit was determined by the activity from which it derives its major income or revenue. The 2009 PSIC was utilized to classify economic units according to their economic activities.
Size of an establishmentis determined by its total employment (TE) as of specific date.
Geographic Classification refers to the classification by geographic area using the Philippine Standard Geographic Code (PSGC) classification.
Methodology
Sampling Design
The survey utilized stratified sampling with 5-digit PSIC serving as the first stratification variable and total employment as the second stratification variable.
For establishments with TE of 20 and over, the 17 administrative regions serve as the geographic domains while the 5-digit level of the 2009 PSIC serves as the industry domains.
Estimation Procedure for Establishments with TE of 20 and Over
- Non-Certainty Stratum (strata of TE 20 to 49 and TE 50 to 99)
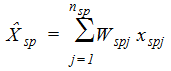
The estimate of the total of a characteristic (  ) for the non-certainty employment strata in an industry domain in each region,
where:
s denotes the non-certainty employment strata in TE of 20 and over
p = 1, 2,..., 17 regions (geographic domains)
xspj= value of the jth establishment in the non-certainty employment strata in TE of 20 and over for an industry domain in each region
j = 1, 2, 3,…,nspestablishments
 = weight of thejthestablishment in the non-certainty employment strata in TE of 20 and over for an industry domain in each region
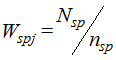
Nsp = total number of establishments in the non-certainty employment strata in TE of 20 and over for an industry domain in each region
nsp = number of sample establishments in the non-certainty employment strata in TE of 20 and over for an industry domain in each region
- Certainty Stratum (TE 100 and over)
The estimate of the total of a characteristic ( ) for the certainty employment stratum in an industry domain in each region,
where:
c denotes the certainty employment strata in TE of 20 and over
p = 1, 2,..., 17 regions (geographic domains)
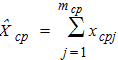
xcpj= value of the jth establishment in the certainty employment strata in TE of 20 and over in an industry domain within each region
j = 1, 2, 3, …,mcp establishments
mcp= number of establishments in the certainty employment strata in TE of 20 and over in an industry domain within each region
- Total Estimate for TE of 20 and Over
The estimate of the total of a characteristic (  ) for the industry domain in each region (geographic domain) was obtained by aggregating the estimates for all employment strata (non-certainty and certainty) in the same industry domain,
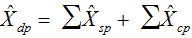
Where dp denotes the industry domains in each region.
National level estimates of the characteristics by industry domain were obtained by aggregating separately the estimates ( ) for the particular industry domain from all the regions
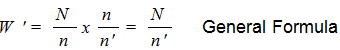
Weight Adjustment Factor for Non-Response
To account for non-response in the non-certainty strata, the adjustment factor (n/n’) was multiplied with the sampling weight (W) of each of the sampling unit. The sampling weight, defined as N/n, was recomputed as
Thus, the adjusted weight (W’spj) for the non-certainty employment stratum for the industry domain with TE 20-99 was
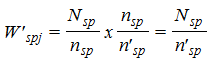
where:
Nsp= total number of establishments in the non-certainty employment stratum with TE 20-99 for the industry domain within each geographic domain (region)
n’sp = number of responding establishments in the non-certainty employment stratum with TE 20-99 for the industry domain within each geographic domain (region)
Response Rate
Response rate for Water Supply; Sewerage, Waste Management and Remediation Activities sector for establishments with TE of 20 and over was 80.9percent (220 out of 272 establishments). This included receipts of "good" questionnaires, partially accomplished questionnaires, reports of closed, moved out or out of scope establishments.
Reports of the remaining non-reporting establishments were imputed based on established imputation methods and from other available administrative data sources. However, reports of establishments which were found to be duplicates and out of business in 2014, were not imputed.
Limitation of Data
Only the formal sector was covered in the survey.
Concepts and Definitions of Terms
Economic activity is the establishment’s source of income. If the establishment is engaged in several activities, its main economic activity is that which earns the biggest income or revenue.
Total employment is the number of persons who worked in for the establishment as of November 15, 2014.
Paid employees are all persons working in the establishment and receiving pay, as well as those working away from the establishment paid by and under the control of the establishment. Included are all employees on sick leave, paid vacation or holiday. Excluded are consultants, home workers, receiving pure commissions only, and workers on indefinite leave.
Compensation is the sum of salaries and wages, separation/retirement/terminal pay, gratuities, and payments made by the employer in behalf of the employees such as contribution to SSS/GSIS, ECC, PhilHealth, Pag-ibig, etc.
Salaries and wages are payments in cash or in kind to all employees, prior to deductions for employee’s contributions to SSS/GSIS, withholding tax, etc. Included are total basic pay, overtime pay and other benefits.
Income or Revenue refers to cash received and receivables for goods/products and by-products sold and services rendered.
E-commerce refers to the selling of products or services over electronic systems such as Internet Protocol-based networks and other computer networks. Electronic Data Interchange (EDI) network, or other on-line system. Excluded are orders received from telephone, facsimile and e-mails.
Expense refers to cost incurred in an enterprise effort to generate revenue, representing the cost of doing business. This is treated on a consumed basis. It excludes cost incurred in the acquisition of income generating assets.
Intermediate expense are expenditures incurred in the production of goods such as materials and supplies used; fuels, lubricants, oils and greases used; electricity and water purchased, and industrial services done by others.
Value addedis gross output less intermediate input. Gross output for the water supply; sewerage, waste management and remediation activities sector is value of output plusincome from non-industrial services done for others (except rent income from land). Intermediate input is intermediate expense plus expense for non-industrial services done by others (except rent expense for land) and all other expenses.
Value of outputrepresents the sum of the receipts from revenue from main activity, income from industrial services done for others, goods sold in the same condition as purchased less the cost of goods sold and value of fixed assets produced on own account.
Gross addition to tangible fixed assets is equal to capital expenditures less sale of fixed assets, including land.
Change in inventories is equivalent to the value of inventories at the end of the year less the value of inventories at the beginning of the year.
Subsidies are all special grants in the form of financial assistance or tax exemption or tax privilege given by the government to aid and develop an industry.