
TABLE A Comparative Summary Statistics for All Education Establishments Philippines, 2017 and 2016

Secondary education industry leads in terms of number of establishments
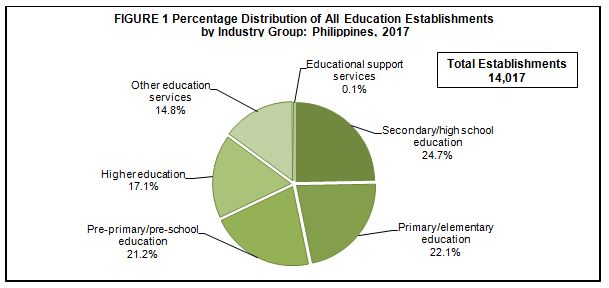
The final results of the Annual Survey of Philippine Business and Industry (ASPBI) showed that a total of 14,017 establishments in the formal sector of the economy were engaged in education activities in 2017. This represents a 0.1 percent increase from the 14,006 establishments reported in 2016.
By industry group, secondary/high school education recorded the highest number of establishments of 3,463 or 24.7 percent of the total. Primary/elementary education followed with 3,095 establishments (22.1%). Educational support services, on the other hand, had the least number of 16 establishments (0.1%).
Figure 1 displays the percentage distribution of the number of establishments for Education sector by industry group in 2017.
Higher education industry hires the highest number of workers
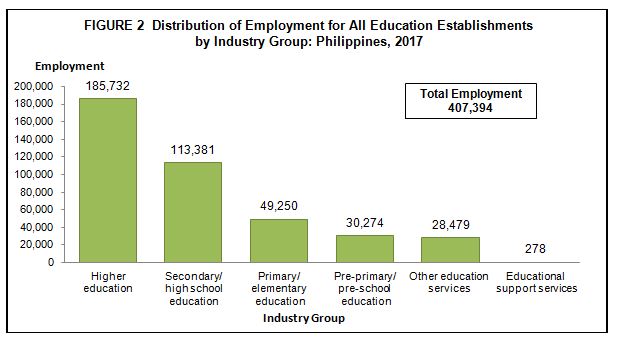
The sector employed a total of 407,394 workers in 2017, higher by 5.2 percent from the 387,155 workers recorded in 2016. Of the total employment, 400,216 workers or 98.2 percent were paid employees while the rest were working owners and unpaid workers.
Among the industries, higher education employed the highest number of workers of 185,732 or 45.6 percent of the total. Secondary/high school education ranked second with 113,381 workers (27.8%). Conversely, educational support services employed the least number of 278 workers (0.1%).
Figure 2 shows the distribution of employment for all education establishments by industry group in 2017.
The sector’s average number of workers was recorded at 29 workers per establishment in 2017, an increase of 3.6 percent compared with the average number of 28 workers in 2016. Higher education had the highest average of 77 workers per establishment. On the other hand, pre-primary/pre-school education posted the lowest average of 10 workers per establishment.
Educational support services industry pays the highest average annual compensation
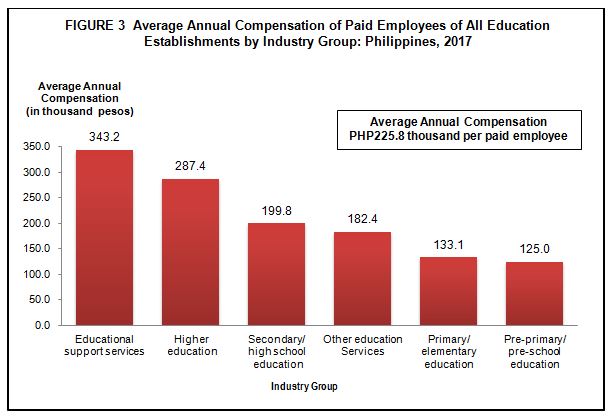
In 2017, the total compensation paid by the sector for all establishments amounted to PHP90.4 billion, which translates to an average annual compensation of PHP225.8 thousand per paid employee. This figure was higher by 3.2 percent from the recorded average annual compensation of PHP218.9 thousand in 2016.
Among industry groups, educational support services paid the highest average annual compensation of PHP343.2 thousand per employee. This was followed by higher education paying PHP287.4 thousand per employee. Pre-primary/pre-school education paid the lowest average annual compensation of PHP125.0 thousand per employee.
Figure 3 shows the average annual compensation of paid employees for all education establishments by industry group in 2017.
Higher education industry tops in terms of income and expense
The total income generated by the sector reached PHP206.3 billion in 2017, an increase of 8.7 percent compared with the PHP189.8 billion income in 2016.
By industry group, higher education earned the highest income worth PHP124.2 billion or 60.2 percent of the total. Secondary/high school education ranked second with income of PHP45.4 billion or 22.0 percent. Educational support services, on the other hand, generated the lowest income of PHP326.0 million or 0.2 percent.
Meanwhile, the total expense incurred by the sector amounted to PHP175.3 billion in 2017, higher by 8.8 percent from the PHP161.1 billion total expense in 2016.
Among the industry groups, higher education, which earned the highest income, also incurred the highest expense of PHP105.9 billion (60.4%). Similarly, educational support services, which generated the least income, also had the lowest expense of PHP262.6 million (0.2%).
The income per peso expense generated by the sector for all establishments remained at 1.18 in 2017. This indicator means that an income of PHP1.18 was generated for every peso spent in the business operations of the sector.
Higher education industry records the highest value added
The total value added generated for all establishments of the sector was PHP140.4 billion in 2017, higher by 9.9 percent than the PHP127.8 billion value added in the previous year.
By industry group, higher education contributed the highest value added worth PHP83.8 billion or 59.7 percent to the total, while educational support services reported the lowest at PHP175.6 million or 0.1 percent.
Labor productivity, defined as the ratio of value added to total employment, was estimated at PHP344.7 thousand per worker in 2017. This indicator was 4.4 percent higher than the PHP330.1 thousand labor productivity in 2016.
Among the industry groups, educational support services emerged as the most labor productive industry with labor productivity of PHP631.6 thousand per worker. Pre-primary/pre-school education, on the other hand, registered the least labor productivity of PHP161.7 thousand per worker.
Figure 4 shows the labor productivity for all education establishments by industry group in 2017.

Higher education industry registers the highest gross additions to tangible fixed assets
The gross additions to tangible fixed assets acquired by the sector reached PHP15.6 billion in 2017, higher by 19.5 percent than the previous year’s record of PHP13.1 billion. Higher education acquired the highest gross additions to tangible fixed assets of PHP11.0 billion or 70.6 percent of the total. This was followed by secondary/high school education with PHP3.4 billion (21.7%). On the other hand, educational support services acquired the lowest, at PHP3.3 million (0.02%).
Change in inventories totals to PHP94.1 million
The total change in inventories (ending less beginning inventories) for the sector was estimated at PHP94.1 million in 2017. Secondary/high school education industry posted the highest change in inventories at PHP48.0 million (51.0%).
Subsidies received from the government amounts to PHP3.7 billion
The total subsidies received by the sector from the government was PHP3.7 billion in 2017. Secondary/high school education received the highest subsidy of PHP2.1 billion (56.5%). On the other hand, pre-primary/pre-school education received the least subsidy of PHP1.6 million (0.04%).
TECHNICAL NOTES
Introduction
This Special Release presents the final results of the 2017 Annual Survey of Philippine Business and Industry (ASPBI) for all Education establishments (Sector P).
The ASPBI is one of the designated statistical activities of the Philippine Statistics Authority (PSA). Data collected from the survey provide information on the levels, structure, performance, and trends of economic activities of the formal sector in the entire country for the year 2017.
The survey was conducted nationwide in 2018 with the year 2017 as the reference period of data, except for employment which is as of 15 November 2017.
Establishment Data Management System (EDMS) was utilized in the decentralized processing of survey returns in the provinces as well as the online accomplishment of questionnaires through the PSA website.
Data are presented by industry group or 3-digit 2009 Philippine Standard IndustrialClassification (PSIC) at the national level.
Legal Authority
The conduct of the 2017 ASPBI is authorized under Republic Act 10625 known as the Philippine Statistical Act of 2013, which mandates reorganizing and strengthening of the Philippine Statistical System (PSS), its agencies and instrumentalities.
Scope and Coverage
The 2017 ASPBI covered establishments engaged in 18 economic sectors classified under the 2009 PSIC, namely:
- Agriculture, Forestry and Fishing (A)
- Mining and Quarrying (B)
- Manufacturing (C)
- Electricity, Gas, Steam, and Air Conditioning Supply (D)
- Water Supply; Sewerage, Waste Management and Remediation Activities (E)
- Construction (F)
- Wholesale and Retail Trade; Repair of Motor Vehicles and Motorcycles (G)
- Transportation and Storage (H)
- Accommodation and Food Service Activities (I)
- Information and Communication (J)
- Financial and Insurance Activities (K)
- Real Estate Activities (L)
- Professional, Scientific and Technical Activities (M)
- Administrative and Support Service Activities (N)
- Education (P)
- Human Health and Social Work Activities (Q)
- Arts, Entertainment and Recreation (R)
- Other Service Activities (S)
The survey was confined to the formal sector of the economy, which consists of the following:
- Corporations and partnership
- Cooperatives and foundations
- Single proprietorship with employment of 10 and over
- Single proprietorships with branches
Hence, the 2017 ASPBI covered only the following economic units:
- All establishments with total employment (TE) of 10 or more, and;
- All establishments with TE of less than 10, except those establishments with Legal Organization = 1 (single proprietorship) and Economic Organization = 1 (single establishment), that are engaged in economic activities classified according to the 2009 Philippine Standard Industrial Classification (PSIC).
Frame of Establishments
The frame for the 2017 ASPBI was extracted from the 2017 List of Establishments (LE). The estimated number of establishments in operation in the country in 2017 totaled to 917,582. About 228,112 establishments (24,9%) of the total establishments comprise the establishments frame are within the scope and coverage of the 2017 ASPBI.
Unit of Enumeration
The unit of enumeration for the 2017 ASPBI is the establishment. An establishment is defined as an economic unit under a single ownership or control which engages in one or predominantly one kind of economic activity at a single fixed location.
Taxonomy of Establishments
An establishment is categorized by its economic organization, legal organization, industrial classification, employment size, and geographic location.
Economic Organization refers to the organizational structure or role of the establishment in the organization. An establishment may be single establishment, branch, establishment and main office with branches elsewhere, main office only, and ancillary unit other than main office.
Legal Organization refers to the legal form of the economic entity which owns the establishment. An establishment may be single proprietorship, partnership, government corporation, stock corporation, non-stock corporation, and cooperative.
Industrial classification of an economic unit was determined by the activity from which it derives its major income or revenue. The 2009 PSIC which was approved for adoption by government agencies and instrumentalities through PSA Resolution No. 01 Series of 2017-158 signed on 14 February 2017 was utilized to classify economic units according to their economic activities.
Size of an establishment is determined by its TE as of a specific date. TE refers to the total number of persons who work in or for the establishment.
This includes paid employees, working owners, unpaid workers and all employees who work full-time or part-time including seasonal workers. Included also are persons on short term leave such as those on sick, vacation or annual leaves and on strike.
Geographic Classification refers to the grouping of establishments by geographic area using the Philippine Standard Geographic Code (PSGC) classification. The PSGC contains the latest updates on the official number of regions, provinces, cities, municipalities, and barangays in the Philippines. The PSGC as of 31 December 2017 was used for the 2017 ASPBI.
Sampling Design
The 2017 ASPBI uses a stratified systematic sampling with 5-digit PSIC serving as industry strata, and employment size as the second stratification variable.
Estimation procedure for Establishments with TE of Less Than 20
a. Non-Certainty Stratum
The estimate of the total of a characteristic (Xs) for the non-certainty employment stratum TE less than 20 in the sth industry domain was
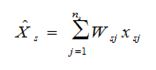
where:
s denotes the non-certainty employment strata in TE of less than 20
Xsj = value of the jth establishment in non-certainty employment stratum in TE of less
than 20 in Sth industry domain
j = 1,2,3..., ns establishments
Wsj = weight of the jth establishment in the non-certainty employment stratum of less
than 20 in the sth industry domain

Ns = total number of establishments in the non-certainty employment stratum in TE of less than 20 in the sth industry domain
ns =number of sample establishments in the non-certainty employment stratum in TE of less than 20 in sth domain
b. Certainty Stratum
The total of a characteristic (Xc ) for the certainty employment stratum in the Cth industry domain was
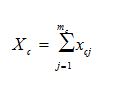
where:
c denotes the certainty employment strata in TE of less than 20 in the cth industry
xcj = value of the jth establishment in the certainty employment strata in TE of less than 20 in the cth industry domain
j = 1,2,3,..., mc establishments
mc = number of establishments in the certainty employment strata in TE of less than 20 in the cth industry domain
c. Total Estimate for TE of Less Than 20
For all sections except B and C, national level estimates of the total of a characteristic  for the industry domain was obtain by aggregating the estimates for all employment strata (non-certainty and certainty) in the same industry domain,
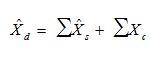
where d denotes the industry domain.
For establishments with TE of 20 and over, the 18 administrative regions serve as the geographic domains while the 5-digit level of the 2009 PSIC serves as the industry domains.
Estimation Procedure for Establishments with TE of 20 and Over
a. Non-Certainty Stratum (strata of TE 20 to 49 and TE 50 to 99)
Sections A, C, E, F, G, H, I, J, K, L, M, N, P, Q, R and S.
The estimate of the total of a characteristic  ) for the non-certainty employment strata in an industry domain in each region,
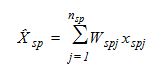
where:
s denotes the non-certainty employment strata in TE of 20 and over
p = 1, 2,..., 18 regions (geographic domains)
xspj = value of the jth establishment in the non-certainty employment strata in TE of 20 and over for an industry domain in each region
j = 1, 2, 3,…, nsp establishments
Wspj = weight of the jth establishment in the non-certainty employment strata in TE of 20 and over for an industry domain in each region
Nsp = total number of establishments in the non-certainty employment strata in TE of 20 and over for an industry domain in each region
nsp = number of sample establishments in the non-certainty employment strata in TE of 20 and over for an industry domain in each region
b. Certainty Stratum (Establishments under the following: Section B and D, ICT core industries, BPM industries, GOCCs and with TE 100 and over)
The estimate of the total of a characteristic  for the certainty employment stratum in an industry domain in each region,
where:
c denotes the certainty employment strata in TE of 20 and over
p = 1, 2,..., 18 regions (geographic domains)
xcpj = value of the jth establishment in the certainty employment strata in TE of 20 and over for an industry domain within each region
j = 1, 2, 3, …, mcp establishments
mcp = number of establishments in the certainty employment strata in TE of 20 and over in an industry domain within each region
c. Total Estimate for TE of 20 and Over.
The estimate of the total of a characteristic  for the industry domain in each region (geographic domain) was obtained by aggregating the estimates for all employment strata (non-certainty and certainty) in the same industry domain,
where dp denotes the industry domains in each region.
National level estimates of the characteristics by industry domain were obtained by aggregating separately the estimates  for the particular industry domain from all the regions.
Weight Adjustment Factor for Non-Response
To account for non-response in the non-certainty strata, the adjustment factor (n/n’) was multiplied with the sampling weight (W) of each of the sampling unit. The sampling weight, defined as N/n, was recomputed as
Thus, the adjusted weight (W’ spj) for the non-certainty employment stratum for the industry domain with TE 20-99 was
where:
Nsp = total number of establishments in the non-certainty employment stratum with TE 20-99 for the industry domain within each geographic domain (region)
n’sp = number of responding establishments in the non-certainty employment stratum with TE 20-99 for the industry domain within each geographic domain (region)
Response Rate
Response rate for all Education establishments was 90.5 percent (1,216 out of 1,344 establishments). This included receipts of "good" questionnaires, partially accomplished questionnaires, reports of closed, moved out or out of scope establishments.
Of the total responses, 54 establishments responded online.
Reports of the remaining non-reporting establishments were taken from the financial statements from Securities and Exchange Commission (SEC) and other available data sources. Reports of establishments that were found to be duplicate of another establishment, out-of-scope and out of business in 2017 were not included in the generation of statistical tables.
Limitation of Data
The survey covered all economic activities of Education sector except public education.
Concepts and Definitions of Terms
Change in inventories is equivalent to the value of inventories at the end of the year less the value of inventories at the beginning of the year.
Compensation is the sum of salaries and wages, separation/retirement/terminal pay, gratuities, and payments made by the employer in behalf of the employees such as contribution to SSS/GSIS, ECC, PhilHealth, Pag-ibig, etc
E-commerce is the selling of products or services over electronic systems such as Internet Protocol-based networks and other computer networks. Electronic Data Interchange (EDI) network, or other on-line system. Excluded are orders received from telephone, facsimile and e-mails.
Establishment is an economic unit under a single ownership and control, i. e. under a single entity, engaged in one or predominantly one kind of economic activity at a single fixed location.
Expense is the cost incurred by the establishment during the year whether paid or payable. This is treated on a consumed basis. Valuation is at purchaser price including taxes and other charges, net of rebates, returns and allowances. Goods and services received by the establishment from other establishments of the same enterprise are valued as though purchased.
Gross additions to tangible fixed assets is equal to capital expenditures less sale of fixed assets, including land.
Income or Revenue is the cash received and receivables for goods/products and by-products sold and services rendered. Valuation is at producer prices (ex-establishment) net of discounts and allowances, including duties and taxes but excluding subsidies.
Inventories are the stock of goods owned by and under the control of the establishment as of a fixed date, regardless of where the stocks are located. Valuation is at current replacement cost in purchaser prices. Replacement cost is the cost of an item in terms of its present price rather than its original cost.
Paid employees are all persons working in the establishment and receiving pay, as well as those working away from the establishment paid by and under the control of the establishment. Included are all employees on sick leave, paid vacation or holiday. Excluded are consultants, home workers, receiving pure commissions only, and workers on indefinite leave.
Salaries and wages are payments in cash or in kind to all employees, prior to deductions for employee’s contributions to SSS/GSIS, withholding tax, etc. Included are total basic pay, overtime pay and other benefits.
Subsidies are special grants in the form of financial assistance or tax exemption or tax privilege given by the government to aid and develop an industry.
Value added is gross output less intermediate input. Gross output for Education sector is the sum of income from service rendered, income from non-industrial service done for others (less rent income from land), sales of goods (less cost of goods sold), grants and donations, other income, capital expenditures of fixed assets produced on own account and change in inventories. Intermediate input is the sum of the following expense items: materials and supplies purchased; fuels, lubricants, oils and greases purchased; electricity purchased, water purchased; industrial services done by others; non-industrial services done by others (less rent expense for land); goods purchased for resale; research and development expense; environmental protection expense; royalty fee; franchise fee and other expense.
See more at the Annual Survey of Philippine Business and Industry (ASPBI) page.
| Attachment | Size |
|---|---|
|
|
14.26 KB |
|
|
12.46 KB |