
Commodity flow or domestic trade refers to the flow of commodities through the water, air and rail transport systems in the country. Data on the inflow and outflow of commodities in the different regions of the country are used to construct interregional and inter-industry relation tables. These serve as bases in the formulation and implementation of various regional development programs like countryside development and port planning.
Quantity of domestic trade declines, value increases
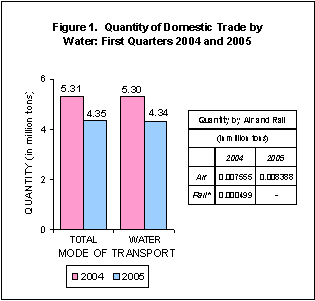
In the first quarter of 2005, the total quantity of domestic trade transactions decreased by 18.1 percent, resulting to 4.35 million tons from 5.31 million tons reported during the same period of last year. Water was the major mode of transport with shares of 99.8 percent in the first quarters of both years 2004 and 2005.
On the other hand, there was an increase in the total value of domestic trade by 3.9 percent from P79.08 billion in the first quarter of 2004 to P82.12 billion in the same period of 2005. The commodities were traded mostly through water comprising 99.6 percent and 99.5 percent in the first quarters of 2004 and 2005, respectively.
Food and live animals contributes about one-third of total domestic trade value
The bulk of the value of commodities that flowed throughout the country in the first quarter of 2005 came from food and live animals with value amounting to P25.36 billion (30.9%). This was followed by mineral fuels, lubricants and related materials with P14.22 billion (17.3%). Machinery and transport equipment was next with P12.58 billion (15.3%). Animal and vegetable oils, fats and waxes generated the least value of P792.75 million (1.0%) (See Table 1).
Similarly, in the first quarter of 2004, food and live animals dominated the domestic trade with a share of 27.8 percent (P21.99 billion) of the total value. Mineral fuels, lubricants and related materials was next with a 18.6 percent share (P14.70 billion). This was followed by machinery and transport equipment followed with a share of 15.8 percent share (P12.50 billion). Contributing the least was animal and vegetable oils, fats and waxes with value amounting only to P1.28 billion (See Table 1).
National Capital Region (NCR) leads in value of domestic trade
In the first quarter of 2005, NCR accounted for 17.9 percent (P14.69 billion), this being the largest share of the total value of domestic trade. This was followed by Northern Mindanao with P13.49 billion (16.4%). Central Luzon was third, contributing P12.67 billion (15.4%). MIMAROPA was next with P7.44 billion (9.1%). Cagayan Valley contributed the least domestic trade share with only P91 thousand.
Likewise, during the first quarter of 2004, NCR reported the highest domestic trade share at P17.33 billion (21.9%). Central Luzon was next with a total value of P15.05 billion (19.0%). Northern Mindanao came up third with P8.63 billion (10.9%). Eastern Visayas followed with P6.77 billion (8.6%). Cagayan Valley remained the least contributing region with only P16 thousand domestic trade share.
Central Luzon posts favorable trade balance
In the first quarter of 2005, inflows in Central Luzon were recorded at P319.44 million resulting to the most favorable balance of trade at P12.35 billion. Four other regions registered more than a billion positive trade balances: Northern Mindanao (P7.90 billion), SOCCSKSARGEN (P3.04 billion), Eastern Visayas (P2.19 billion), and Davao Region (P1.06 billion). However, inflows for Central Visayas amounted to P13.06 billion resulting to the largest unfavorable balance of trade of negative P11.20 billion. Other regions with more than a billion negative trade balances were NCR (-P8.25 billion), CALABARZON (-P2.45 billion), Caraga (-P2.26 billion), and Zamboanga Peninsula (-P 1.44 billion).
Similarly, in the first quarter of 2004, Central Luzon realized the most favorable trade balance at P14.73 billion. Other regions that posted more than a billion positive trade balances amounting to P3.93 billion, P2.58 billion, P2.21 billion and P1.77 billion were SOCCSKSARGEN, Northern Mindanao, Eastern Visayas, and CALABARZON, respectively. Central Visayas also suffered the most unfavorable balance of trade at negative P8.05 billion.
Notes:
- DOMSTAT reports from the following provinces/cities were not yet received as of June 17, 2005, and were not included in this special release:
- Negros Occidental - Coastwise (January to March, 2005)
- Cebu - Coastwise (January to March, 2005)
- Isabela City - Coastwise (February 2005)
- Zamboanga City - Air (March 2005)
- Misamis Oriental - Air (March 2005)
- Basilan - Coastwise (February 2005)
- Sulu - Coastwise (January to March, 2005)
- There was no Rail Transaction in the First Quarter of 2005 due to the railroad accident in November 2004, which resulted to the stoppage of the operation of the Philippine National Railways (PNR).
Source: National Statistics Office
Manila, Philippines