
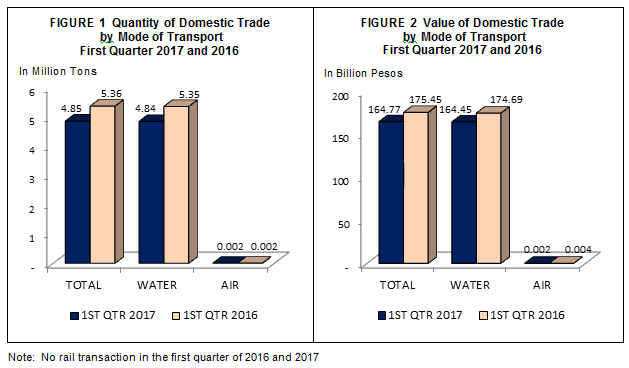
Quantity of domestic trade decreases during the first quarter of 2017
The total quantity of domestic trade during the first quarter of 2017 was registered at 4.85 million tons, down by 9.5 percent from 5.36 million tons of the same quarter of the previous year. Food and live animals commodities were the highest, in terms of quantity, with 1.38 million tons (28.4%) of all the traded commodities. Animal and vegetable oils, fats and waxes had the least quantity with only 0.02 million tons.
Similarly, the value of domestic trade was recorded at PHP164.773 billion. It decreased by 6.1 percent from PHP175.451 billion posted in same quarter of previous year.
About 99.84% of the total commodities that flow in the country were traded by means of water and the remaining 0.16% is through air.
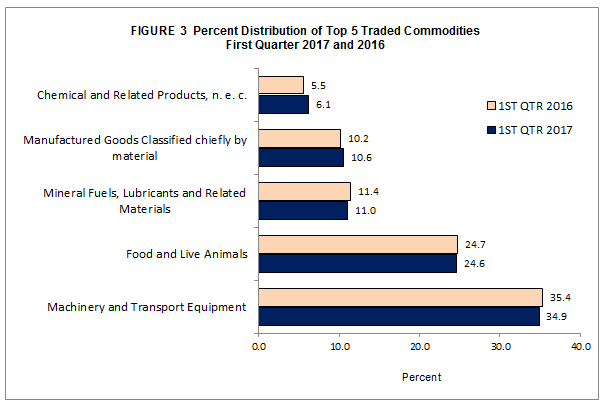
Machinery and transport equipment account for 34.9 percent of total value of traded commodities
Machinery and transport equipment were the top traded commodities in the country in the first quarter of 2017 with value amounting to PHP56.971 billion. Although this commodity topped during the first quarter of 2017, it decreased by 8.1 percent, from PHP62.025 billion reported in the same quarter of 2016. Food and live animals with PHP40.007 billion (24.2%) and manufactured goods classified chiefly by material with value amounting to PHP18.302 billion (11.1%) placed second and third, respectively. The rest of the traded commodities with their corresponding values in the first quarter of 2017 were the following:
-
Mineral fuels, lubricants and related materials, PHP17.433 billion;
-
Chemical and related products n.e.c., PHP9.933 billion;
-
Miscellaneous manufactured articles, PHP6.493 billion;
-
Beverages and Tobacco, PHP6.170 billion;
-
Commodities and transactions n.e.c., PHP4.493 billion;
-
Crude materials,inedible except fuels, PHP3.772 billion; and
-
Animal and vegetable oils, fats and waxes, PHP1.196 billion
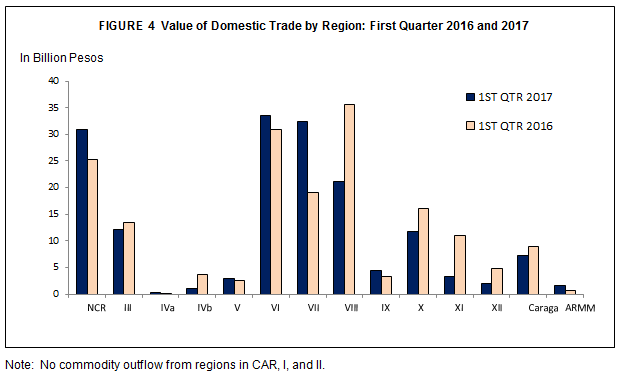
Western Visayas posts the highest domestic trade value
The Western Visayas Region exhibited the highest share on domestic trade value during the first quarter of 2017, with value amounting to PHP33.472 billion. This is an increase of 8.6 percent from PHP30.810 billion posted in the same quarter of 2016. This was followed by Central Visayas with PHP32.476 billion and National Capital Region (NCR) with PHP30.973 billion. CALABARZON had the least traded value worth PHP229.21 million. Domestic trade values of other regions were the following:
- Eastern Visayas, PHP21.223 billion;
- Central Luzon, PHP12.209 billion;
- Northern Mindanao, PHP11.704 billion;
- Caraga, PHP7.182 billion;
- Zamboanga Peninsula, PHP4.493 billion;
- Davao Region, PHP3.318 billion;
- Bicol Region, PHP2.853 billion;
- SOCCSKSARGEN, PHP1.900 billion;
- ARMM, PHP1.695 billion; and
- MIMAROPA, PHP1.046 billion
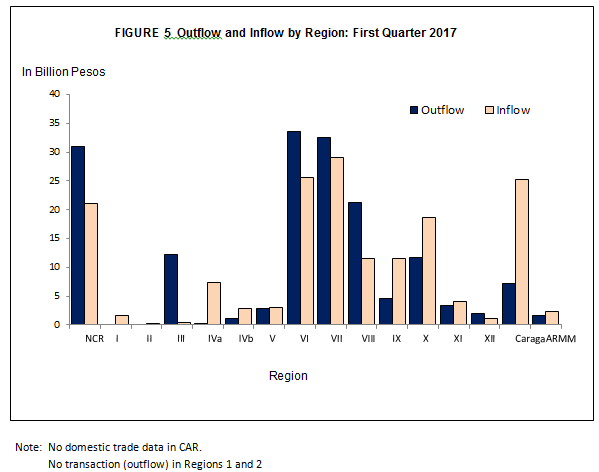
Outflow and Inflow value of traded commodities decrease in the first quarter of 2017
Outflow refers to the total quantity value of commodities which goes out of the specified region or province while Inflow refers to the total qunatity value of commodities coming in the specified region. Trade balance is the difference between the outflow and inflow.
Total outflow in the first quarter of 2017 reached PHP164.773 billion, drop by 6.1 percent, from PHP175.451 billion recorded in the same quarter of 2016. Western Visayas area registered the highest outflow value amounting to PHP33.472 billion or 20.3 percent from the total. It was followed by Central Visayas and National Capital Region with PHP32.476 billion (19.7%) and PHP30.973 billion (18.8%), respectively.
Central Visayas had the highest inflow value amounting to PHP29.008 billion during the first quarter of 2017. This translates to a percent share of 17.6 percent of the total. Cagayan Valley region had the lowest inflow value at PHP19.87 million.
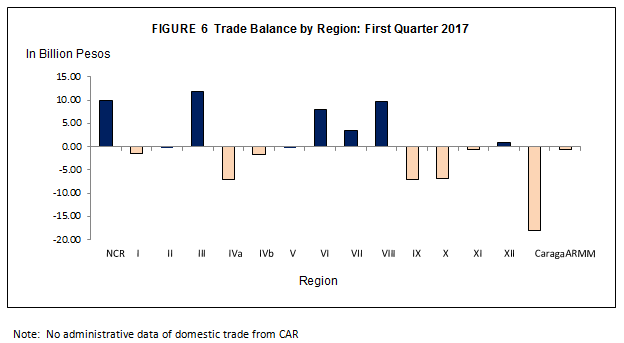
Central Luzon shows favorable trade balance
In the first quarter of 2017, Central Luzon registered the highest positive trade balance of PHP11.868 billion. National Capital Region (NCR) placed second with value at PHP9.858 billion. Other regions having the positive trade balance were the following:
- Eastern Visayas, PHP9.777 billion;
- Western Visayas, PHP7.929 billion;
- Central Visayas, PHP3.468 million; and
- SOCCSKSARGEN, PHP852.42 million
On the other hand, regions with unfavorable trade balance during the first quarter of 2017 were the following:
- Caraga, (PHP18.001 billion);
- CALABARZON, (PHP7.130 billion);
- Zamboanga Peninsula, (PHP7.072 billion);
- Northern Mindanao, (PHP6.882 billion);
- MIMAROPA, (PHP1.736 billion);
- Ilocos Region, (PHP1.553 billion);
- Davao Region, (PHP649.70 million);
- ARMM, (PHP586.84 million)
- Bicol Region, (PHP121.39 million; and
- Cagayan Valley, (PHP19.87 million)
TECHNICAL NOTES
Introduction
Commodity flow or domestic trade statistics is a compilation of data on commodities carried through the air, rail, and water transport systems in the country.
The Philippine Statistics Authority (PSA) compiles domestic trade statistics from copies of coasting manifests and coastwise passenger manifest collected from the Philippine Ports Authority and copies of airway bills to generate commodity flow or domestic trade statistics. Coasting manifest were collected from major ports and other active seaports listed by the PPA all over the country to account for transactions that went through seaports.
Data on the inflow and outflow of commodities in the different regions of the country are used to construct inter-regional and inter-industry relation tables.
All copy of documents were compiled and processed by the provincial statistical offices. Final data review of the data files, generation of statistical tables, and preparation of Special Release were done at the Trade Statistics Division (TSD). All documents received as of 6 June 2017 were processed and included in the generation of 2017 First Quarterly statistical tables. Documents received after the deadline are included in the final tabulation.
The 1993 Philippine Standard Commodity Classification (PSCC) is used to classify the commodities at the 5-digit (item) for coastwise statistics and 3-digit (group) for air statistics for statistical purposes.
DOMSTAT reports from the following provinces/cities were not yet received as of 6 June 2017 and thus, were not included in this Special Release:
|
Province |
Mode of Transport |
Reference Quarter |
|---|---|---|
|
Coastwise |
January to March |
|
Coastwise |
January to March |
Detaile data on domestic trade statistics are available at the Trade Statistics Division (TSD) - Economic Sector Statistics Service (ESSS) with telephone number: 376-19-75.
Limitations of Domestic Trade Data
The domestic trade data contained in this report pertains to the flow of goods through airports and seaports in the country, whether for government or private use, or for commercial purposes. Domestic trade through land was excluded because of an absence of an approach to data in the archipelagic island of the country. Moreover, data on rail transport is also excluded.
Air waybills, on the other hand, were collected from the Philippine Airlines accounting for transactions that passes through all airports.
Goods and/or commodities that were excluded in the compilation of data are:
a. Goods transported by vessels of the Philippine Navy.
b. Fish and other marine products landed directly from the sea.
c. Service cargoes for consumption of the vessel crew.
d. Cadaver