
Domestic traded commodities increase in the fourth quarter 2016
The total quantity of domestic trade in the fourth quarter 2016 registered 6.21 million tons, up by 25.8 percent from 4.94 million tons of the same quarter of the previous year.
Similarly, the value of domestic trade in 2016 posted PHP181.639 billion, an increase by 45.6 percent from PHP124.728 billion posted in 2015.
About 99.8% of the total commodities that flow in the country were traded by means of water and the remaining 1.2 percent is through air.
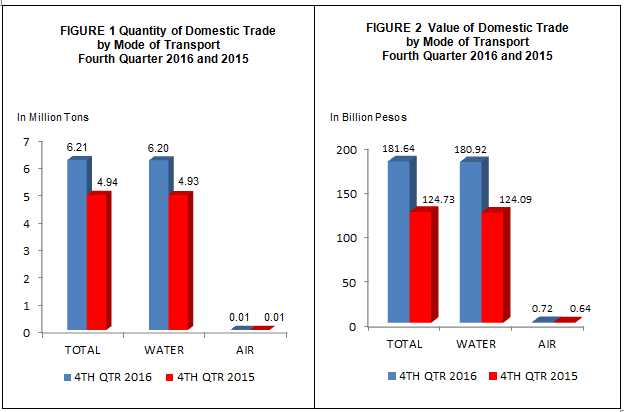
Note: No rail transaction in the fourth quarters of 2015 and 2016
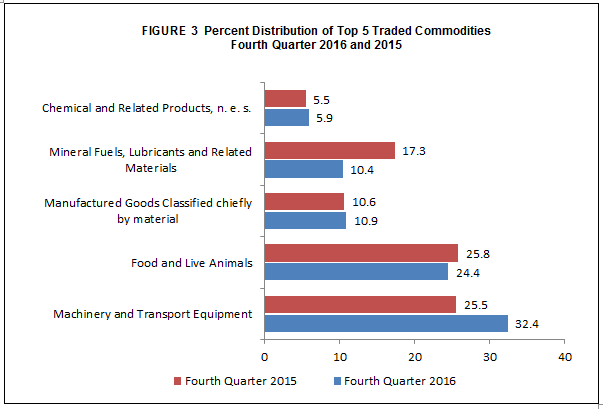
Machinery and transport account for 32.4 percent of total value of traded commodities
Machinery and transport equipment were the top traded commodities in the country in the fourth quarter 2016 with value amounting to PHP58.836 billion. It increased by 84.6 percent, from PHP31.866 billion reported in the same quarter of 2015. Food and live animals with PHP44.403 billion (24.4%) and manufactured goods classified chiefly by material with PHP19.783 billion (10.9%) placed second and third, respectively in the fourth quarter of 2016. The rest of the traded commodities with their corresponding values in the fourth quarter 2016 were the following:
-
Mineral fuels, lubricants and related materials, PHP18.936 billion;
-
Chemical and related products n.e.c., PHP10.738 billion;
-
Beverages and Tobacco, PHP9.604 billion;
-
Miscellaneous manufactured articles, PHP7.878 billion;
-
Commodities and transactions n.e.c., PHP6.897 billion;
-
Crude materials,inedible except fuels, PHP3.479 billion; and
-
Animal and vegetable oils, fats and waxes, PHP1.082 billion
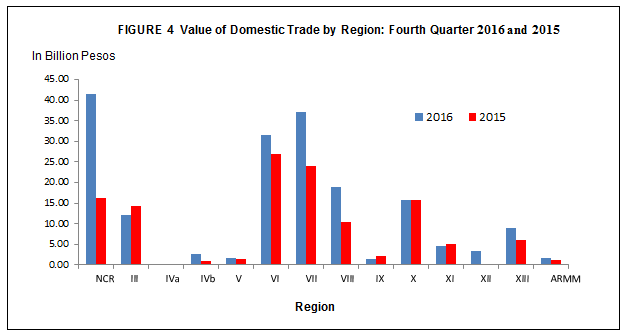
National Capital Region (NCR) post the highest domestic trade value
The National Capital Region reported the highest share on domestic trade value at PHP41.547 billion, an increase of 154.3 percent from PHP16.336 billion posted in the same quarter of 2015. This was followed by Central Visayas, PHP37.163 billion and Western Visayas, PHP31.550 billion during fourth quarter 2016. The following are the traded values of other regions:
- Eastern Visayas (PHP18.849 billion);
- Northern Mindanao (PHP15.726 billion);
- Central Luzon (PHP12.133 billion);
- Caraga (PHP8.909 billion);
- Davao Region (PHP4.658 billion);
- SOCCSKSARGEN (PHP3.359 billion);
- MIMAROPA (PHP2.665 billion);
- Bicol Region (PHP1.787 billion);
- ARMM (PHP1.633 billion);
- Zamboanga Peninsula (PHP1.447 billion); and
- CALABARZON (PHP212.18 million)
Note: No outflow of commodity from regions in CAR, I, and II.
Outflow and Inflow of traded commodities in fourth quarter 2016
Total outflow in the fourth quarter 2016 reached PHP181.640 billion. NCR got the highest outflow value amounting to PHP41.547 billion or 22.9 percent from the total outflow in the country. It was followed by Central Visayas and Western Visayas with PHP37.163 billion (20.5%) and PHP31.550 billion (17.4%), respectively. CALABARZON had the least outflow value with PHP212.19 million (0.1%) in 2016.
On the other hand, Central Visayas had the highest inflow value amounting to PHP34.377 billion in fourth quarter 2016. This translates to 18.9 percent of all traded commodities. Cagayan Valley region had the lowest inflow value with PHP75.08 million during the fourth quarter 2016.
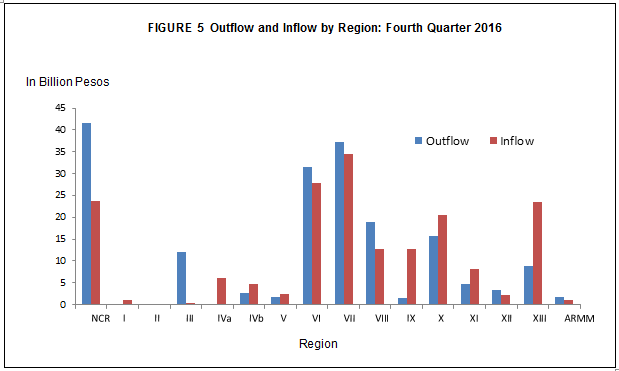
Note: No administrative data of domestic trade from CAR.
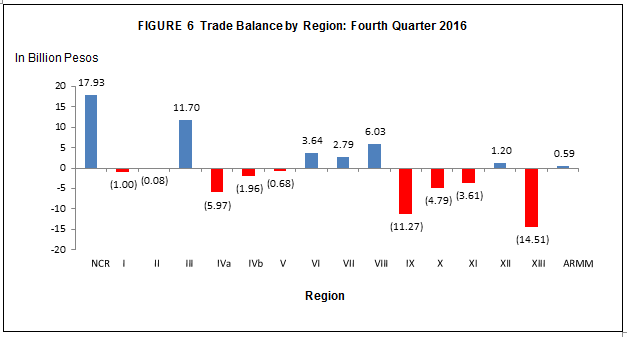
National Capital Region exhibit favorable trade balance
In the fourth quarter of 2016, NCR registered the highest positive trade balance at PHP17.928 billion. Other regions having positive trade balance were the following:
- Central Luzon, PHP11.695 billion;
- Eastern Visayas, PHP6.026 billion;
- Western Visayas, PHP3.641 billion;
- Central Visayas, PHP2,786 billion; and
- SOCCSKSARGEN, PHP1.197 billion
On the other hand, regions with unfavorable trade balance in fourth quarter 2016 were the following:
- Zamboanga Peninsula, PHP11.273 billion;
- CALABARZON, PHP5.974 billion;
- Northern Mindanao, PHP4.788 billion;
- Davao Region, PHP3.609 billion; and
- MIMAROPA, PHP1.959 billion
Technical Notes
The Philippine Statistics Authority (PSA) compiled domestic trade statistics from copies of coasting manifests and coastwise passenger manifest collected from Philippine Ports Authority and copies of airway bills from Philippine Airlines to generate commodity flow or domestic trade statistics.
Commodity flow or domestic trade statistics is a compilation of data on commodities carried through the air, rail, and water transport systems in the country. However, data thru rail transport is excluded in the statistics
Data on the inflow and outflow of commodities in the different regions of the country are used to construct inter-regional and inter-industry relation tables.
DOMSTAT reports from the following provinces/cities were not yet received as of December 12, 2016, thus, were not included in this special release:
|
Province |
Mode of Transport |
Reference Quarter |
|---|---|---|
|
Coastwise |
October to December |
|
Coastwise |
October to December |
Note: As of fourth quarter of 2016, Philippine National Railways (PNR) has no rail cargo manifest transaction.
All copy of documents are compiled and processed by all PSA provincial statistical offices. Final data review of the data files, generation of quarterly statistical tables, and preparation of Special Release are done in the Central Office. All documents received after the cut-off date, however, are processed and included in the generation of the annual revised statistical tables. Processing includes coding, editing, review and validation using the Domestic Trade Statistics System version 2.1 (DTSS).
The Special Release of the Commodity Flow in the Philippines is posted in the PSA website three months after the reference quarter.
The 1993 Philippine Standard Commodity Classification (PSCC) is used to classify the commodities at the most detailed level for statistical purposes.
Data on domestic trade statistics are available at Trade Statistics Division with telephone number: 376-19-75, Economic Sector Statistics Service (ESSS).