
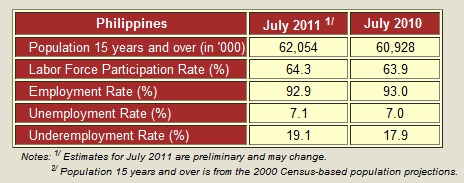
The number of employed persons in July 2011 Labor Force Survey (LFS) was estimated at 37.1 million. This number translates to an employment rate of 92.9 percent. The employment rate in the same quarter last year was 93.0 percent. Across regions, Cagayan Valley had the highest employment rate at 97.6 percent, followed by Zamboanga Peninsula (96.7%), Autonomous Region in Muslim Mindanao (ARMM) (96.3%) and MIMAROPA (96.2%). The National Capital Region (NCR) had the lowest employment rate at 89.1 percent.
The July 2011 LFS also revealed that the number of persons in the labor force, or those who were either employed or unemployed, is approximately 39.9 million out of the estimated 62.0 million population 15 years old and over. Correspondingly, these numbers translate to a labor force participation rate (LFPR) of 64.3 percent, compared to last year's figure of 63.9 percent. The LFPR was highest in MIMAROPA at 69.8 percent, and lowest in ARMM at 54.1 percent.
Of the estimated 37.1 million employed persons in July 2011, those in the services sector comprised the largest proportion, accounting for more than half (52.2%) of the total employed population. Around one-third (32.6%) were in the agriculture sector and the rest (15.2%) were in the industry sector.
Among the various occupation groups, laborers and unskilled workers comprised the largest group, making up 32.6 percent of the total employed population. This was also the largest occupation group in July 2010 (31.8%). Farmers, forestry workers and fishermen were the second largest group of workers accounting for 15.2 percent of the total employed.
Employed persons fall into any of these categories: wage and salary workers, self-employed workers without any paid employee, employer in own-operated farm or business and unpaid family workers. Wage and salary workers are those who work for private households, private establishments, government or government controlled corporations, and those who work with pay in own family-operated farm or business. More than half (56.3%) of the total employed persons in July 2011 were wage and salary workers, most of them working for private establishments (42.4% of the total employed). Those working for the government or government controlled corporations accounted for 8.3 percent of the total employed, while workers in private households, 5.3 percent.
Self-employed workers without any paid employee constituted 29.5 percent of the total employed while employers in own family-operated farm or business made up 3.5 percent. The unpaid family workers accounted for 10.7 percent.
Employed persons are classified as either full-time workers or part-time workers. Full-time workers are those who work for 40 hours or more during the reference week while part-time workers work for less than 40 hours. Sixty-five percent of the total employed persons in July 2011 were full-time workers. Part-time workers comprised 34.1 percent.
Employed persons who express the desire to have additional hours of work in their present job or to have additional job, or to have a new job with longer working hours are considered underemployed. The number of underemployed persons in July 2011 was estimated at 7.1 million, placing the underemployment rate at 19.1 percent. More than half (55.8%) of the total underemployed were reported as visibly underemployed or working less than 40 hours during the reference week. Those working for 40 hours or more accounted for 42.7 percent. Most of the underemployed were working in the agriculture sector (43.7%) and services sector (40.7%). The underemployed in the industry sector accounted for 15.7 percent.
The number of unemployed persons in July 2011 was estimated at 2.8 million which translated to an unemployment rate of 7.1 percent. Last year's estimate was 7.0 percent.
There were more males (62.6%) than females (37.4%) among the unemployed. More than half (53.1%) of the unemployed were in age group 15 to 24 years. One-third (33.6%) of the unemployed were high school graduates, 21.8 percent were college undergraduates, and 20.8 percent were college graduates.
(Sgd.) CARMELITA N. ERICTA
Administrator
Technical Notes
Starting July 2003, the Labor Force Survey (LFS) adopted the 2003 Master Sample Design, with a sample size of approximately 50,000 households. The 1992 four-digit code for Philippine Standard Occupational Classification (PSOC) and 1994 Philippine Standard Industrial Classification (PSIC) were used in classifying the occupation and industry.
Starting April 2005, the new unemployment definition was adopted per NSCB Resolution Number 15 dated October 20, 2004. As indicated in the said resolution, the unemployed include all persons who are 15 years and over as of their last birthday and are reported as: (1) without work and currently available for work and seeking work; or (2) without work and currently available for work but not seeking work for the following reasons:
1.) Tired/believed no work available
2.) Awaiting results of previous job application
3.) Temporary illness/disability
4.) Bad weather
5.) Waiting for rehire/job recall
Starting with the January 2007 LFS round, the population projections based on the 2000 Census of Population was adopted to generate the labor force statistics. This is in compliance with NSCB Resolution No. 1 series of 2005 entitled "Adoption of the Methodology Used in Generating the 2000 Census of Population and Housing-Based National Population Projections".
Starting with the January 2010 LFS round, a revised nomenclature on class of worker was adopted. In the reports on previous rounds of LFS, particularly in the statistical tables on employed persons by class of worker, the self-employed and employer in own family-operated farm or business were classified as own-account workers. For the same statistical table. In this report, the term own-account worker no longer appears as heading for employer and self-employed to avoid confusion. In the International Classification of Status in Employment (ICSE), the term "own-account workers" is synonymous to the category "self-employed" in the Philippine LFS. .
Source: Income and Employment Statistics Division
Household Statistics Department
National Statistics Office
Manila, Philippines
Page last revised: September 15, 2011