Starting April 2005, the new unemployment definition has been adopted per NSCB Resolution Number 15 dated October 20, 2004. The new definition is presented in the Technical Notes of this report.
For comparative purposes, aside from the April 2008 LFS results, the textual tables presented contain final estimates for the April 2007 survey round.

Sixty-three percent of the population 15 years old and over are in the labor force
Out of the estimated 57.7 million population 15 years old and over in April 2008, 36.5 million were in the labor force. This placed the labor force participation rate (LFPR) at 63.2 percent, lower than last year's rate of 64.5 percent.
The highest LFPR was reported in Northern Mindanao where 69.6 percent of the regions working age population were in the labor force. The lowest LFPR reported was in Autonomous Region in Muslim Mindanao (ARMM) at 56.4 percent.
Employment rate is reported at 92.0 percent
The number of employed persons in April 2008 was 33.5 million. This is 169 thousand less than the 33.7 million employed persons reported in April 2007. The employment rate in April 2008 or proportion of employed persons to total labor force was estimated at 92.0 percent, almost the same percentage recorded in April 2007 at 92.6 percent.
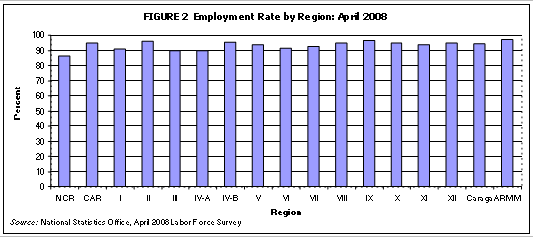
Two regions registered a high employment rate, with 97 for every 100 of their labor force were reported as employed in April 2008. These are ARMM (97.0%) and Zamboanga Peninsula (96.6%). Only two regions registered employment rates lower than 90 percent, namely, NCR (86.2%) and CALABARZON (89.7%).
Employed males outnumber employed females
The employed population consisted of 61.9 percent males and 38.1 percent females. Employment rate reported among females (92.1%) was higher than males (91.9%).

About half (50.1%) of the employed population were in age group 25 to 44 years while one in five (19.5%) employed persons were in the youngest age group 15 to 24 years.
Services sector comprises half of the employed population
Almost half (49.6%) of the employed population were in the services sector. About 35.5 percent were in the agriculture sector and the remaining 14.9 percent, in the industry sector.
Both the agriculture and services sector had increase level of employment. The number of employed persons in the agriculture sector increased by 0.4 percent or 52 thousand and in the services sector, 0.2 percent or 26 thousand. Meanwhile, the level of employment in the industry sector went down by 4.7 percent or 247 thousand.

The increase in the level of employment in the agriculture sector came from the agriculture, hunting and forestry sub-sector which posted an increase of 163 thousand. The fishing sub-sector reported a decrease of 112 thousand employed persons.
The number of employed persons in the services sector remained at about 16.6 million. There were 112 thousand additional workers in the public administration and defense; and compulsory social security sub-sector but the level of employment in the wholesale and retail trade sub-sector declined by 128 thousand.
All industry sub-sectors went down in terms of level of employment. The biggest decline came from the manufacturing sub-sector with a decrease of 190 thousand workers.
One in three employed persons is a laborer or unskilled worker
Of the various occupation groups, the laborers and unskilled workers comprised the largest group, making up 32.7 percent of the total employed population in April 2008. Farmers, forestry workers, and fishermen came next with the most number of employed persons totaling to 5.7 million (17.0% of the total employed).
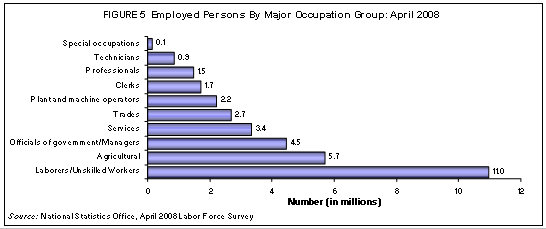
The largest increase in number among occupational groups was reported among officials of the government, corporate executives, managers, managing proprietors, and supervisors with 523 thousand additional workers. Meanwhile, farmers, forestry workers, and fishermen were down by 347 thousand.
Number of own account workers decreases
Employed persons fall into any of these three classes of workers: wage and salary workers, own account workers and unpaid family workers. Wage and salary workers are those who work for private households, private establishments, government or government-owned/controlled corporations and those who work with pay in a family-operated/owned farms or businesses. Of the total employed population in April 2008, 52.9 percent were wage and salary workers, mostly working for private establishments (39.8% of the total employed). Those working for the government or government-owned/controlled corporations accounted for 8.0 percent of the total employed population and 4.7 percent were workers in private households. Own account workers, such as proprietors and self-employed workers, constituted 34.6 percent of the total employed, with the self-employed workers having the larger share (30.0% of the total employed). Unpaid family workers were estimated with 12.5 percent share.

Growth was seen among wage and salary workers, from 17.2 million in April 2007 to 17.7 million in April 2008. The number of own account workers decreased by 3.8 percent or 454 thousand and unpaid family workers, 4.7 percent or 207 thousand.
The increase among wage and salary workers was mostly due to the 430 thousand increase in this class of worker in the agriculture sector. The decrease in the number of unpaid family workers was mainly in the agriculture sector (163 thousand). Among own account workers, a decrease of 215 thousand workers in the agriculture sector and 202 thousand in the services sector was recorded.
Number of part-time workers decrease largely
Employed persons are classified as either full-time workers or part-time workers. Full-time workers are those who work for 40 hours or more while part-time workers work for less than 40 hours a week. More than half (61.9%) of the total employed persons in April 2008 were full-time workers, most of them working for 40 to 48 hours (38.7% of total employed). Part-time workers comprised 35.6 percent of the total employed.
Full-time workers increased by 10.9 percent, from 18.7 million in April 2007 to 20.7 million in April 2008. On the other hand, part-time employees decreased to 12.0 million in April 2008 from 14.1 million the same period last year.
Underemployment rate goes up to 19.8 percent from 18.9 percent
Underemployed persons are employed persons who express the desire to have additional hours of work in their present job or an additional job, or have a new job with longer working hours. They were estimated at 6.6 million in April 2008, which was 247 thousand more than the figure in the same month a year ago. The underemployment rate or the proportion of underemployed persons to total employed went up to 19.8 percent in April 2008 from 18.9 percent in April 2007. About 57.5 percent of the underemployed were reported as visibly underemployed or had been working for less than 40 hours a week.
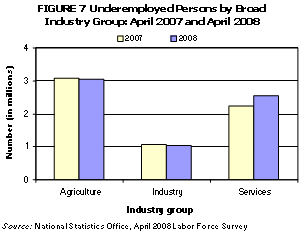
The underemployed were found mostly in the agriculture sector, registering at 46.0 percent. Underemployed persons in the services sector accounted for 38.4 percent while those in the industry sector, 15.5 percent. A decrease in the level of underemployment was noted among the agriculture and industry sectors. Underemployed persons in the agriculture and industry sectors decreased by 34 thousand and 21 thousand, respectively. The number of underemployed persons in the services sector went up by 13.4 percent or 302 thousand.
Unemployment rate is reported at 8.0 percent
Of the 36.5 million population in the labor force, 2.9 million were reported unemployed. This resulted to an unemployment rate of 8.0 percent in April 2008, compared to last year�s estimate of 7.4 percent.
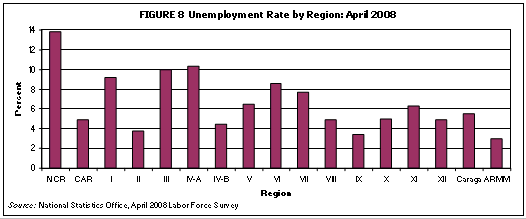
Three regions recorded double-digit unemployment rates with NCR registering the highest at 13.8 percent. The two other regions were CALABARZON (10.3%) and Central Luzon (10.0%).
Half of the unemployed are aged 15 to 24 years
The proportion of males among unemployed (62.4%) was higher than that of females (37.6%). Most of the unemployed belonged to the younger age groups, that is, 51.2 percent were aged 15 to 24 years, 30.2 percent were 25 to 34 years, and 9.5 percent were 35 to 44 years. Among unemployed persons, those who had attained high school level comprised 45.3 percent, of which 32.0 percent of the total unemployed were high school graduates. About 40.0 percent of the total unemployed had reached college level and 14.0 percent attained elementary level.
Seven for every ten persons not in the labor force are women
About 21.3 million persons aged 15 years and over in April 2008 were not in the labor force, like housewives, students, persons with disability, and retirees. They constituted 36.8 percent of the total population 15 years old and over. Females comprised 71.2 percent of the total persons not in the labor force.
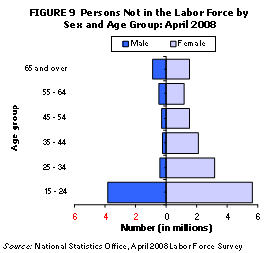
By age group, those who were 15 to 24 years old comprised the largest proportion among those who were not in the labor force (44.8%), followed by those who were 25 to 34 years old (16.7%). Persons in the age group 65 years and over comprised 11.4 percent of the population not in the labor force.
SUMMARY

Labor force participants, or those who are either employed or unemployed, numbered 36.5 million, resulting to a labor force participation rate of 63.2 percent.
The number of employed persons decreased by 169 thousand, from 33.7 million in April 2007 to 33.5 million in April 2008.
Employment rate was reported at 92.0 percent in April 2008 while it was 92.6 percent in April 2007.
An increase of 52 thousand workers was registered in the agriculture sector and 26 thousand additional workers in the services sector. On the other hand, employment in the industry sector declined by 4.7 percent or 247 thousand.
Laborers and unskilled workers continued to make up the largest proportion of the employed as they comprised almost one-third (32.7%) of the employed population. Farmers, forestry workers, and fishermen came second with 17.0 percent.
More than half (52.9%) of the total employed persons were wage and salary workers, 34.6 percent were own account workers and 12.5 percent were unpaid family workers.
The incidence of underemployment went up to 19.8 percent in April 2008 from 18.9 percent in April 2007.
In April 2008, the number of unemployed persons was 2.9 million, placing the unemployment rate at 8.0 percent.
TECHNICAL NOTES
The Labor Force Survey (LFS) is a nationwide quarterly survey conducted by the National Statistics Office (NSO). For this release, the data being presented are based on the final results of the April 2008 round of the LFS.
The reference period used in the survey is the past seven (7) days preceding the date of visit of the enumerator.
The concepts and definitions used in the survey can be found in the regular NSO-ISH Bulletins. Some are given below:
b. Employed - consists of persons in the labor force who are reported either as at work or with a job or business although not at work. Persons at work are those who did some work, even for an hour during the reference period.
c. Unemployed - consists of persons in the labor force who are reported (1) without work; (2) currently available for work; and (3) seeking work or not seeking work because of the belief that no work is available or awaiting results of previous job application, or because of temporary illness, bad weather or waiting for rehire or job recall.
Note: The above definition of unemployed has been adopted starting April 2005 per NSCB Resolution No. 15 dated October 20, 2004.
d. Underemployment - refers to employed persons who express the desire to have additional hours of work in their present job or an additional job, or have a new job with longer working hours.
e. Labor Force Participation Rate (LFPR) - proportion of total labor force to the total household population 15 years old and over.
f. Employment Rate - proportion of employed persons to the total labor force.
g. Unemployment Rate - proportion of unemployed persons to the total labor force.
h. Underemployment Rate - proportion of underemployed persons to total employed persons.
a. Labor Force - refers to the population 15 years old and over who contribute to the production of goods and services in the country. It comprises the employed and unemployed.
Starting with the July 2003 round, the quarterly Labor Force Survey uses the 2003 Master Sample Design. Using this master sample design, the number of samples increased from 41,000 to around 51,000 households.
The 1992 four-digit code for Philippine Standard Occupational Classification (PSOC) and 1994 Philippine Standard Industrial Classification (PSIC) were used in classifying the occupation and industry.
Starting with the January 2007 LFS round, the population projections based on the 2000 Census of Population has been adopted to generate the labor force statistics. This is in compliance with NSCB Resolution No. 1 series of 2005 entitled Adoption of the Methodology Used in Generating the 2000 Census of Population and Housing-Based National Population Projections.
Source: National Statistics Office
Manila, Philippines
