
Release Date :
Reference Number :
2015-054
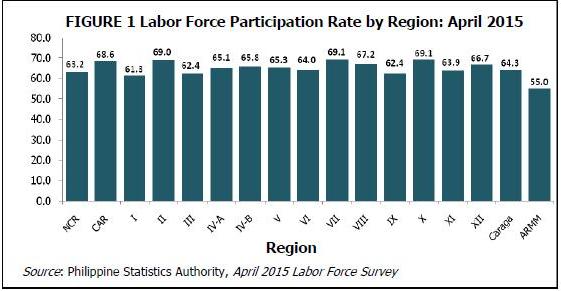
Sixty-four percent of the population 15 years old and over were in the labor force
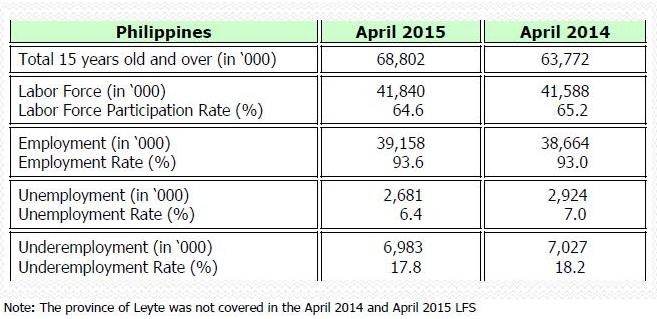
Of the estimated 64.8 million population 15 years old and over in April 2015, the number of persons who were in the labor force was reported at 41.8 million. This placed the labor force participation rate (LFPR) at 64.6 percent, which means that six in ten of the population aged 15 years and over were either employed or unemployed. The lowest LFPR reported was in Autonomous Region in Muslim Mindanao at 55.0 percent (Table 1).
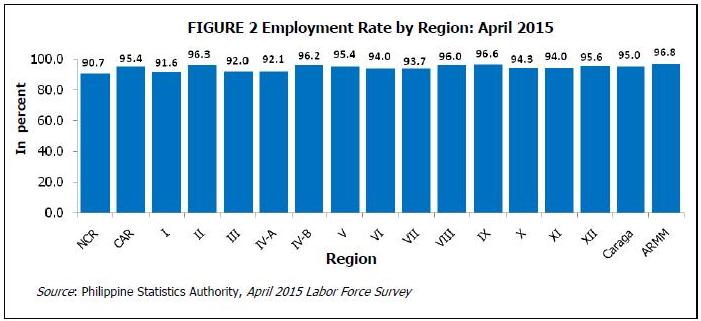
Employment rate reached 93.6 percent in April 2015
The total number of employed persons was estimated at 39.2 million in April 2015. The employment rate reported or the proportion of employed persons to total labor force was 93.6 percent (Table 1). Four among the 17 regions registered an employment rate lower than the national figure. These are the NCR (90.7%), Ilocos Region (91.6%), Central Luzon (92.0%), and CALABARZON (92.1%) (Table 1 and Figure 2).
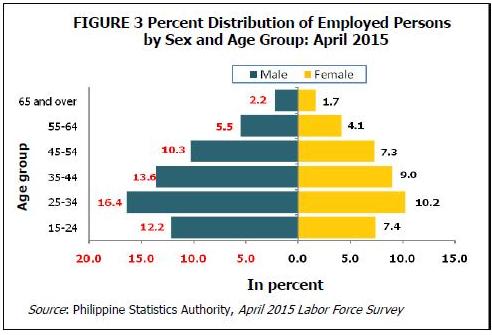
Employed males were more than employed females
Sixty percent of the estimated 39.2 million total employed persons in April 2015 were males. The largest number of employed persons consists of age group 25 to 34 years with 26.6 percent of the total employed. The 35 to 44 age group comprised the second largest group (22.6%), while the 15 to 24 age group made up the third largest group (19.6%) (Table 3).
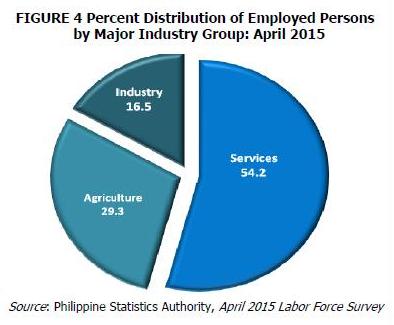
More than 50 percent of employed persons are in the services sector
More than half (54.2%) of the employed population were in the services sector. Although employment in the agriculture sector decline in April 2015, it remained the second largest group making up 29.3 percent of the total employed. In the industry sector, only the construction sub-sector posted an increase of 7.1 percent from the 6.8 percent in April 2014.
Among workers in the services sector, those engaged in wholesale and retail trade or in the repair of motor vehicles and motorcycles made up the largest percentage which accounted for 19.1 percent of the total employed in April 2015 (Table 4).
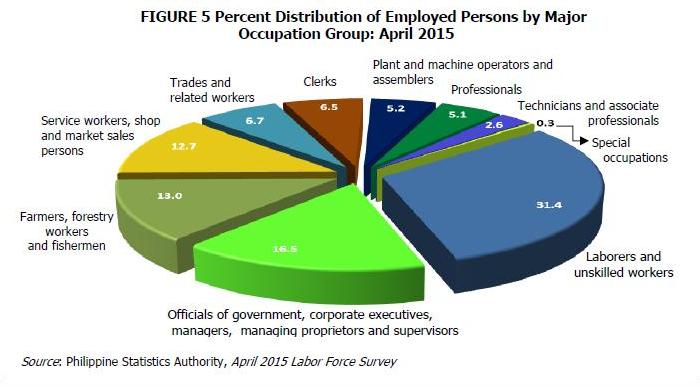
One in three employed persons was a laborer or unskilled worker
Of the various occupation groups, laborers and unskilled workers made up the largest group making up 31.4 percent of the 39.2 million total employed population. Officials of the government and special-interest organizations, corporate executives, managers, managing proprietors, and supervisors made up the second largest group of workers with 16.5 percent of the total employed. Farmers, forestry workers, and fishermen were the third largest group of workers with 13.0 percent of the total employed in April 2015. Service workers and shop and market sales workers were the fourth largest group accounting for 12.7 percent (Table 5).
More than 50 percent of the employed persons were wage and salary workers
Employed persons fall into any of these categories: wage and salary workers, self-employed without any paid employee, employer in own family-operated farm or business and unpaid family workers. Wage and salary workers are those who work for private households, private establishments, government and government-controlled corporations and those who work with pay in own family-operated farm or business.
In April 2015, wage and salary workers were registered at 57.8 percent. Those who worked in private establishments made up 44.6 percent, and those working for the government and government-controlled corporations accounted for 8.2 percent (Table 6).
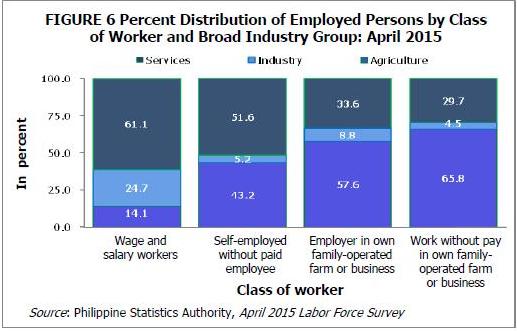
Classified according to the broad industry groups, nearly seven in ten (65.8%) unpaid family workers were in the agriculture sector while 61.1 percent wage and salary workers were in the services sector. The self-employed without any paid employee in the services sector made up 51.6 percent of the total 11.0 million self-employed workers (Table 7 and Figure 6).
Six in every ten of employed persons worked full time
Employed workers are classified as either full-time or part-time workers. Full-time workers are those who work for 40 hours or more while part-time workers work for less than 40 hours. In April 2015, full-time workers comprised 58.2 percent of the total employed persons. Those working for 40 to 48 hours made up a larger proportion (38.6% of the total employed) than those working for more than 48 hours (19.7%). Part-time workers which comprised 39.6 percent of the total employed in April 2015, increased from the 38.7 percent of the total employed persons in April 2014 (Table 8).
Underemployment rate was registered at 17.8 percent
Underemployed persons are employed persons who express the desire to have additional hours of work in their present job or to have an additional job, or a new job with longer working hours.
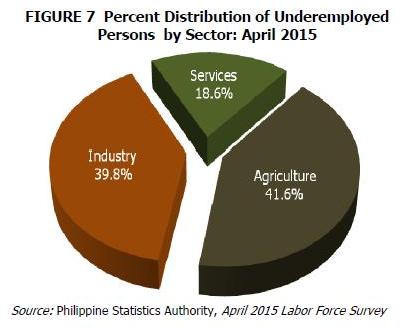
About 7.0 million underemployed persons were recorded in April 2015. Of this number, 41.6 percent worked in the agriculture sector, 39.8 percent were in the services sector while 18.6 percent of these underemployed workers were in the industry sector (Figure 7).
Visibly underemployed persons are those persons who had been working for less than 40 hours a week. Sixty one percent were reported as visibly underemployed out of the 7.0 million underemployed workers. Majority of these workers (76.9%) were in the agriculture sector (Table 9).
Unemployment rate was recorded at 6.4 percent
The unemployment rate or the proportion of unemployed persons to the labor force was estimated at 6.4 percent in April 2015 (Table 1). This placed the number of unemployed persons at 2.7 million (Table 2).
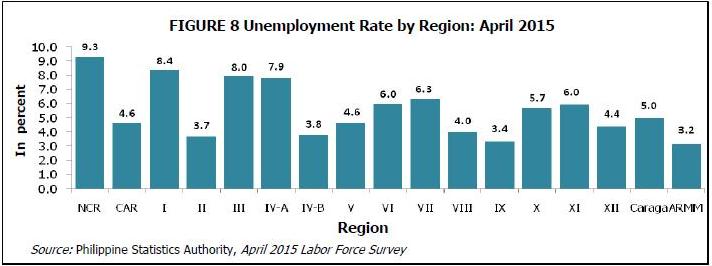
Among the regions, the National Capital Region (9.3%), Ilocos Region (8.4%), Central Luzon (8.0%), and CALABARZON (7.9%) had unemployment rates higher than the national figure of 6.4 percent (Table 1 and Figure 8).
More males (63.1%) were unemployed than females (36.9%). Fifty percent of the unemployed persons were in age group 15 to 24 years (Table 3).
Across educational groups, 33.3 percent of the unemployed were high school graduates, 22.2 percent were college graduates, 5.9 percent were elementary graduates, and 7.7 percent finished post secondary courses.
Seventy percent of persons not in the labor force were women
One-third or 35.4 percent of the 64.8 million population 15 years old and over in April 2014 were not in the labor force. These include housewives, students, persons with disability, and those who have retired from their employment. Seven in ten (69.3%) of those who were not in the labor force are women.
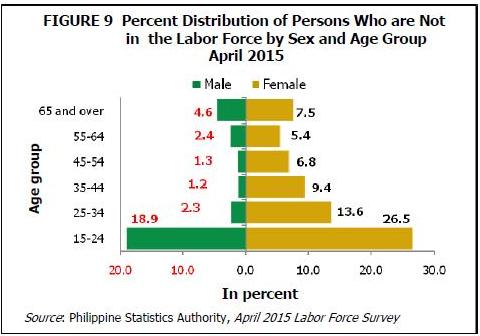
Forty-five percent (45.5%) of those who were not in the labor force were in age group 15-24 years (Table 3).
___________________________________________________________________
1The province of Leyte was not covered in the April 2015 LFS.
SUMMARY
• The labor force population in April 2015 was estimated at 41.8 million. This translates to a labor force participation rate (LFPR) of 64.6 percent.
• Total employed persons in April 2015 were approximately 39.2 million, resulting to a national employment rate of 93.6 percent.
• More than half (54.2%) of the total employed persons were in the services sector, 29.3 percent were in the agriculture sector, and 16.5 percent were in the industry sector.
• Laborers and unskilled workers made up the largest proportion of employed persons as they comprised 31.4 percent of the total employed population.
• Total unemployed persons were accounted at 2.7 million which translates to an unemployment rate of 6.4 percent.
• Underemployment rate was recorded at 17.8 percent in April 2015.
• Persons not in the labor force were accounted at 23.0 million of which 69.3 percent were women.
TECHNICAL NOTES
The Labor Force Survey (LFS) is a nationwide quarterly survey conducted by the Philippine Statistics Authority (PSA) during the months of January, April, July, and October. For this release, the data being presented are based on the final results of the April 2015 round of the LFS.
The reference period used in the survey is the past seven (7) days preceding the date of interview of the enumerator.
The concepts and definitions used in the survey can be found in PSA Integrated Survey of Households (ISH) Bulletins. Some are given below:
a. Labor Force – refers to the population 15 years old and over who contribute to the production of goods and services in the country. It comprises the employed and unemployed.
b. Employed – refers to persons in the labor force who are reported either as at work or with a job or business although not at work. Persons at work are those who did some work, even for an hour during the reference period.
c. Unemployed – refers to persons in the labor force who are reported as:
1. without work; and
2. currently available for work; and
3. seeking work or not seeking work due to the following reasons:
i. belief that no work is available, or
ii. awaiting results of previous job application, or
iii. because of temporary illness or disability, or
iv. bad weather, or
v. waiting for rehire or job recall.
The new definition of unemployed was adopted starting April 2005 per NSCB Resolution No. 15 dated October 20, 2004.
The old definition of unemployed considered only two criteria:
1. Without work and looking for work; or
2. Without work and not looking for work due to reasons cited in 3(i) to 3(v).
d. Underemployed – refers to employed persons who express the desire to have additional hours of work in their present job or an additional job, or a new job with longer working hours.
e. Labor Force Participation Rate (LFPR) – refers to the proportion of total labor force to the total household population 15 years old and over.
f. Employment Rate – refers to the proportion of employed persons to the total labor force.
g. Unemployment Rate – refers to the proportion of unemployed persons to the total labor force.
h. Underemployment Rate – refers to the proportion of underemployed persons to total employed persons.
In July 2003, the LFS adopted the 2003 Master Sample Design, with a sample size of approximately 50,000 households.
The province of Basilan is now under the Autonomous Region in Muslim Mindanao (ARMM) while Isabela City (Basilan) is under Region IX, in accordance with Executive Order No. 36.
Starting with the July 2007 LFS round, the population projections based on the 2000 Census of Population and Housing was adopted to generate the labor force statistics. The 2000 CPH-based population projections has been endorsed as the official figures to be utilized for planning and programming purposes per NSCB Resolution No. 7 Series of 2006, entitled “Adoption of the Methodology Used in Generating the 2000 Census of Population and Housing-Based National, Regional, and Provincial Population Projections”.
A revised nomenclature on class of worker was adopted since January 2010 LFS round. In the reports on previous rounds of LFS, particularly in the statistical tables on employed persons by class of worker, the self-employed and employer in own family-operated farm or business were classified as own-account workers. For the same statistical table in this report, the term “own-account worker” no longer appears as heading for employer and self-employed to avoid confusion. In the International Classification of Status in Employment (ICSE), the term “own-account workers” is synonymous to the category “self-employed” in the Philippines LFS.
In January 2012, the LFS adopted the 2009 four-digit Philippine Standard Industrial Classification (PSIC) codes in classifying the industry. Prior to this, the 1994 PSIC was used. The 1992 four-digit Philippine Standard Occupational Classification (PSOC) code, updated in 2002, was utilized. Question on vocational course was included in the questionnaire during this round.
In the LFS, data on the economic characteristics of household members who are overseas workers are not collected because they are not considered as part of the labor force in the country. Hence, they are excluded in the estimation of the size of working population, that is, population aged 15 years and older.
The province of Leyte was not covered during the April 2015 round. A new sampling frame for the province of Leyte has to be created. This is because of the large number of households in Leyte which were displaced by typhoon Yolanda. The old listing of households for Leyte used as sampling frame for the 2003 Master Sample is no longer usable.