
|
||||||||||||||||||||||||||||||||||||||||||||||||
|
Top 10 Philippine Imports from All Countries: April 2005 |
|||
|
Gainers |
Losers |
||
|
Cereals and Cereal Preparations |
116.0 |
Telecommunication Equipment and Electrical Machinery |
-16.5 |
|
Power Generating and Specialized Machinery |
112.1 |
Industrial Machinery and Equipment |
-13.2 |
|
Mineral Fuels, Lubricants and Related Materials |
69.7 |
Electronic Products |
-5.9 |
|
Iron and Steel |
32.0 |
Plastics in Primary and Non-Primary Forms |
-4.3 |
|
Transport Equipment |
25.1 |
|
|
|
Textile Yarn, Fabrics, Made-Up Articles and Related Products |
7.3 |
|
|
January to April total trade stands at $25.825 billion
Total external trade in goods for January to April 2005 amounted to $25.825 billion, an increment of 1.8 percent from $25.368 billion during the same period a year earlier. However, total foreign-made merchandise slightly dropped by 1.0 percent to $13.076 billion from $13.206 billion. In contrast, exports registered a year-on-year growth of 4.8 percent to aggregate dollar revenue of $12.749 billion from $12.162 billion last year. Balance of trade in goods (BOT-G) deficit for the Philippines reached $328 million lower compared from last year’s deficit of $1.044 billion.
Figure 1A. Philippine Trade Performance in January - April :2004 and 2005
(F.O.B. Value in Million US Dollar)
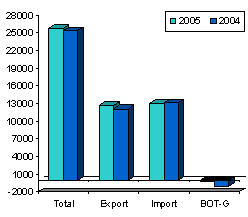
Figure 1B. Philippine Trade Performance in April :2004 - 2005
(F.O.B. Value in Million US Dollar)
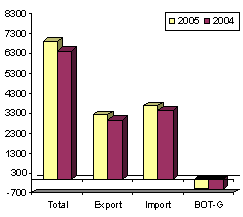
April imports register 6.5 percent increase
Total merchandise trade for April 2005 grew by 7.6 percent to $6.909 billion from $6.422 billion during the same period of the previous year. Dollar-inflow generated by exports amounted to $3.229 billion, or 8.8 percent higher than last year’s $2.969 billion. In the same way, after a series of negative year-on-year growth since December 2004, expenditures for imported goods picked up by 6.5 percent to $3.680 billion from $3.454 billion. The balance of trade in goods (BOT-G) registered a deficit of $451 million, slightly lower compared to last year’s deficit of $485 million.
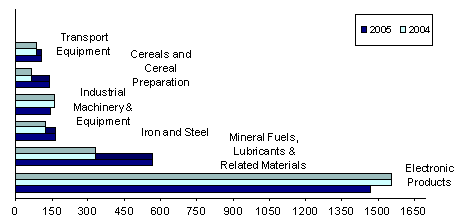
Electronic products account for 39.9 percent of import bill
Accounting for 39.9 percent of the total aggregate import bill, payments for electronic products amounted to $1.466 billion or a decline of 5.9 percent over last year’s figure of $1.557 billion. Compared to the previous month’s level, purchases gained by 3.8 percent from $1.413 billion.
Imports of mineral fuels, lubricants and related materials in April ranked second with 15.4 percent share. Expenditures at $566.33 million, posted a 69.7 percent growth over the previous year’s level of $333.82 million.
Iron and steel, the third top import was worth $166.94 million, or an increase of 32.0 percent from $126.47 million a year ago.
Industrial machinery and equipment, contributing 3.9 percent to the total bill, was RP’s fourth top import for the month with payments at $142.22 million or a slump of 13.2 percent from last year’s $163.83 million.
Cereals and cereal preparations, accounting for 3.8 percent of the total imports, ranked fifth as it jumped by 116.0 percent with foreign bill amounting to $140.77 million from $65.17 million last year.
Expenditures for transport equipment, with a 2.9 percent share, went up by 25.1 percent to $107.80 million from $86.16 million in April 2004.
Rounding up the list of the top imports for April 2005 were textile yarn, fabrics, made-up articles and related products, $97.43 million; plastics in primary and non-primary forms, $73.93 million; telecommunication equipment and electrical machinery, $67.73 million; and power generating and specialized machinery, $65.91 million.
Aggregate payment for the country’s top ten imports for April 2005 reached $2.895 billion or 78.7 percent of the total bill.
Figure 2. Philippine Top Imports in April 2004 and 2005
(F.O.B. Value in Million US Dollar)
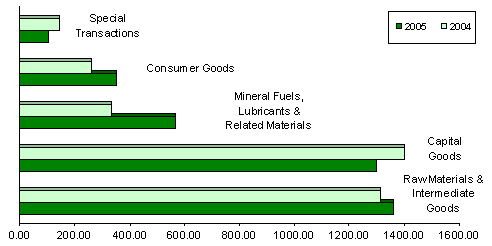
Raw materials and intermediate goods account for 37.0 percent of the total imports
Payments in April for raw materials and intermediate goods accounted for 37.0 percent as importation increased by 3.5 percent to $1.361 billion from last year’s figure of $1.315 billion. Semi-processed raw materials got the biggest share of 33.6 percent and valued at $1.238 billion.
Capital goods comprising 35.3 percent of the total imports declined by 7.2 percent year-on-year to $1.299 billion from $1.400 billion. The major share went to telecommunication equipment and electrical machinery with an 18.6 percent share of the total imports and billed at $684.36 million.
Expenditures for mineral fuels, lubricants and related materials went up by as much as 69.7 percent to $566.33 million from $333.82 million during the same period of 2004.
Purchases of consumer goods, amounted to $350.97 million, an increase of 34.1 percent from $261.75 million in April 2004, while special transactions decreasedl by 28.6 percent to $102.29 million from $143.27 million.
Figure 3. Philippine Imports by Major Type of Goods in April: 2004 and 2005
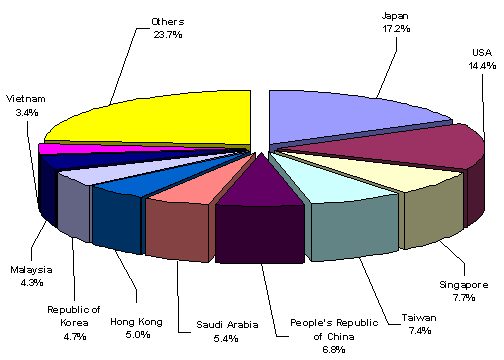
Japan corners 17.2 percent of april import bill
Imports from Japan accounting for 17.2 percent of the total import bill, went down by 1.8 percent to $634.36 million from $645.67 million during the same period of 2004. Exports to Japan, amounted to $600.33 million yielding a two-way trade value of $1.235 billion and a trade deficit for RP placed at $34.03 million.
United States, the country’s second biggest source of imports for April with a 14.4 percent share, reported shipments billed at $528.76 million against exports earnings of $530.74 million. Total trade amounted to $1.060 billion, with a trade surplus registered at $1.98 million.
Singapore followed as the third biggest source of imports. With payments worth $282.88 million, imports clmbed by 8.7 percent from $260.21 million, while revenue from RP’s exports reached $223.90 million resulting to a total trade value of $506.77 million and a $58.98 million deficit for Philippines.
Other major sources of imports for the month of April were Taiwan, $270.65 million; People’s Republic of China, $252.15 million; Saudi Arabia, $200.72 million; Hong Kong, $183.36 million; Republic of Korea, $174.30 million; Malaysia, $156.99 million; and Vietnam, $123.17 million.
Payments for imports from the top ten sources for the month amounted to $2.807 billion or 76.3 percent of the total.
Figure 4. Philippine Imports by Country in April: 2005
As of press time, 27 out of 54,190 export documents and 35 out of 76,869 import documents are still expected from the ports.
|
(Sgd.) CARMELITA N. ERICTA |
Source: National Statistics Office
Manila, Philippines
| Attachment | Size |
|---|---|
|
|
6.01 KB |
|
|
6.44 KB |
|
|
9.37 KB |
|
|
12.55 KB |
|
|
10.29 KB |
|
|
7.45 KB |
|
|
6.44 KB |