
A. Total Agricultural Trade
1. Total agricultural trade increased by 5.1 percent
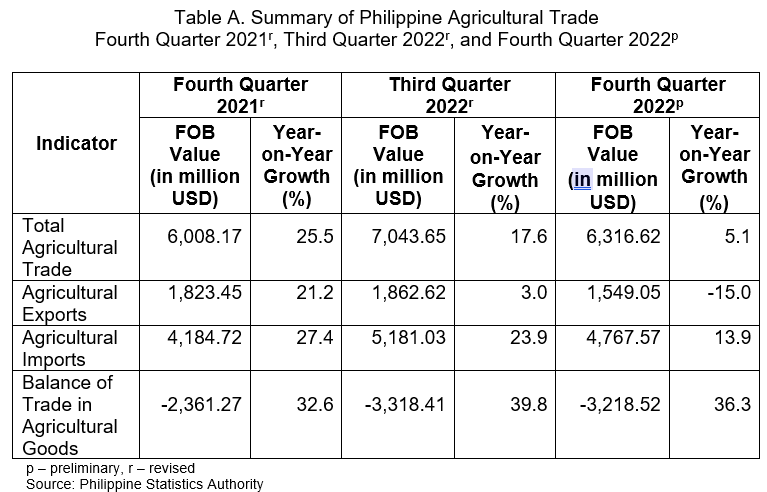
The country’s total agricultural trade in the fourth quarter of 2022, which amounted to USD 6.32 billion, grew at an annual rate of 5.1 percent. This was lower than the annual rates of 17.6 percent and 25.5 percent recorded in the third quarter of 2022 and fourth quarter of 2021, respectively.
In the fourth quarter of 2022, total agricultural exports was recorded at USD 1.55 billion or 24.5 percent share to total agricultural trade, while agricultural imports accounted for USD 4.77 billion or 75.5 percent of the total agricultural trade. (Figure 1 and Tables A and 1)
2. Agricultural trade balance increased by 36.3 percent
In the fourth quarter of 2022, the total balance of trade in agricultural goods was USD -3.22 billion. This reflects a deficit with an annual growth of 36.3 percent. In the third quarter of 2022, the annual increase in the trade deficit went up by 39.8 percent, while the trade deficit in the fourth quarter of 2021 posted an annual increment of 32.6 percent. (Tables A and 1)
B. Agricultural Exports
1. Agricultural exports went down by -15.0 percent
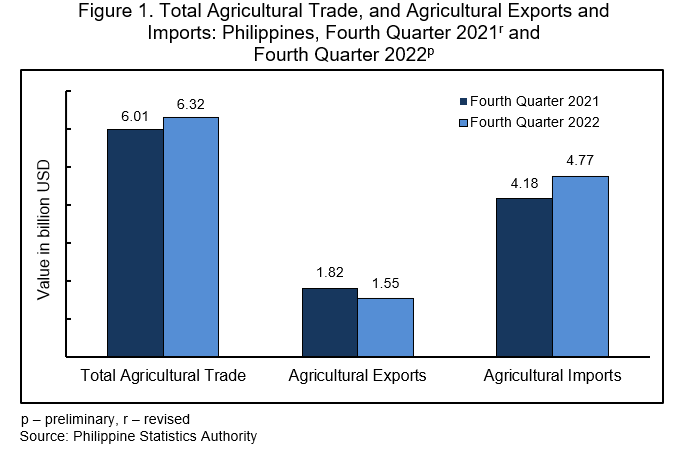
The country’s agricultural exports revenue dropped to USD 1.55 billion or by -15.0 percent annual rate in the fourth quarter of 2022 from USD 1.82 billion agricultural export revenue in the fourth quarter of 2021. In the fourth quarter of 2022, the value of agricultural exports accounted for 7.6 percent of the country’s total exports. (Figure 2 and Tables A and 1)
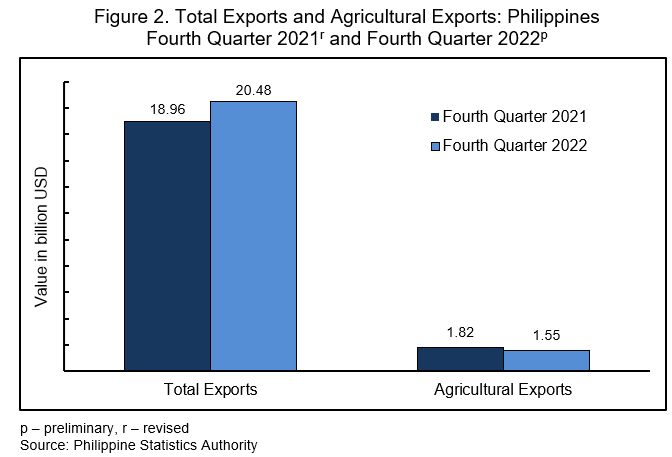
2. Edible fruit and nuts; peel of citrus fruit melons commodity group accounted for the largest share to the total agricultural exports
The top 10 commodity groups in terms of value of agricultural exports contributed USD 1.50 billion or 96.8 percent of the total agricultural exports’ revenue in the fourth quarter of 2022. The combined export value of these top 10 commodity groups posted an annual decrease of -14.9 percent during the quarter.
Among the commodity groups, edible fruit and nuts; peel of citrus fruit melons, which was valued at USD 720.94 million, comprised the largest share of 28.1 percent to the total agricultural exports for the fourth quarter of this year. (Figure 3 and Table 3)
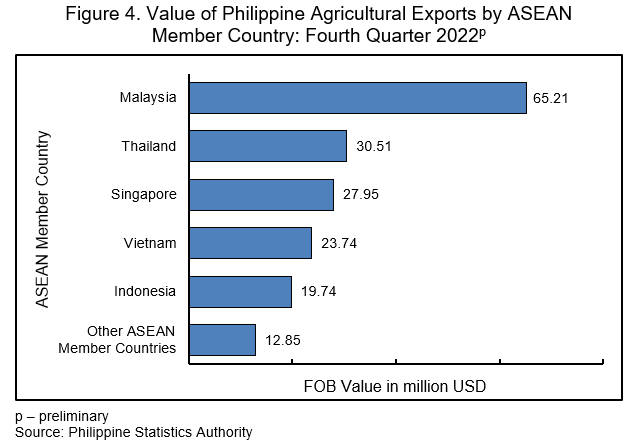
3. Malaysia led as a trading partner in agricultural exports among Association of Southeast Asian Nations (ASEAN) member countries
The country’s agricultural exports to ASEAN member countries in the fourth quarter of 2022 amounted to USD 179.99 million, which accounted for almost 6.0 percent of the total value of exports to ASEAN member countries. Among the ASEAN member countries, Malaysia was the top buyer of agricultural exports worth USD 65.21 million, recording a share of 36.2 percent to the total value of agricultural exports to ASEAN member countries for the fourth quarter of 2022. (Figure 4 and Table 7)
4. Tobacco and manufactured tobacco substitutes commodity group was the top agricultural export to ASEAN member countries
The top three major agricultural commodities exported to ASEAN member countries in the fourth quarter of 2022 were:
a. tobacco and manufactured tobacco substitutes, USD 64.33 million;
b. animal or vegetable fats and oils and their cleavage products; prepared edible fats; animal or vegetable waxes, USD 35.74 million; and
c. miscellaneous edible preparations, USD 16.90 million. (Table 7)
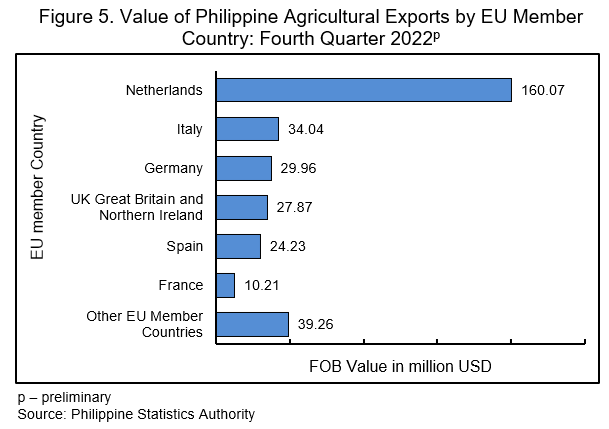
5. Netherlands was the country’s major trading partner in the export of agricultural goods among European Union (EU) member countries
Exports of agricultural goods to EU member countries in the fourth quarter of 2022 reached USD 325.64 million, which contributed 12.9 percent to the country’s total value of exports to EU member countries.
Among the EU member countries, Netherlands was the country’s top destination of agricultural commodities worth USD 160.07 million or 49.2 percent of the total agricultural exports to EU member countries for this quarter of 2022. (Figure 5 and Table 9)
6. Animal or vegetable fats and oils and their cleavage products; prepared edible fats; animal or vegetable waxes commodity group was the top agricultural export to EU member countries
The top three major agricultural commodities exported to EU member countries in the fourth quarter of 2022 were:
a. animal or vegetable fats and oils and their cleavage products; prepared edible fats; animal or vegetable waxes, USD 166.45 million;
b. preparations of meat, of fish or of crustaceans, molluscs and other aquatic invertebrates, USD 47.13 million; and
c. lac; gums, resins and other vegetable saps and extracts, USD 35.05 million. (Table 9)
C. Agricultural Imports
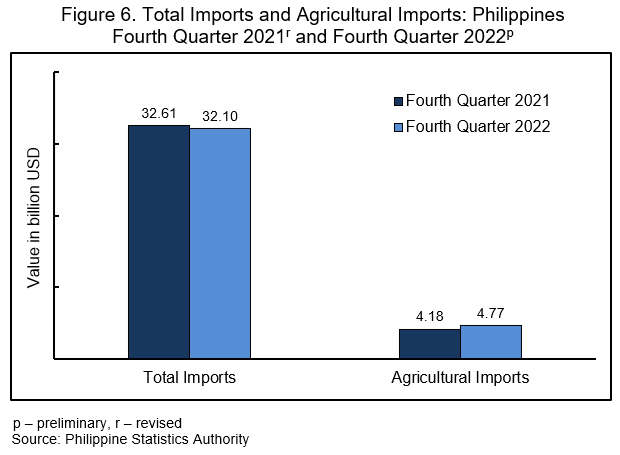
1. Agricultural imports increased annually by 13.9 percent
The total agricultural imports was valued at USD 4.77 billion representing a share of 14.9 percent to the country’s total imports in the fourth quarter of 2022. It went up by 13.9 percent compared with its value of USD 4.18 billion in the fourth quarter of 2021. (Figure 6 and Tables A and 1).
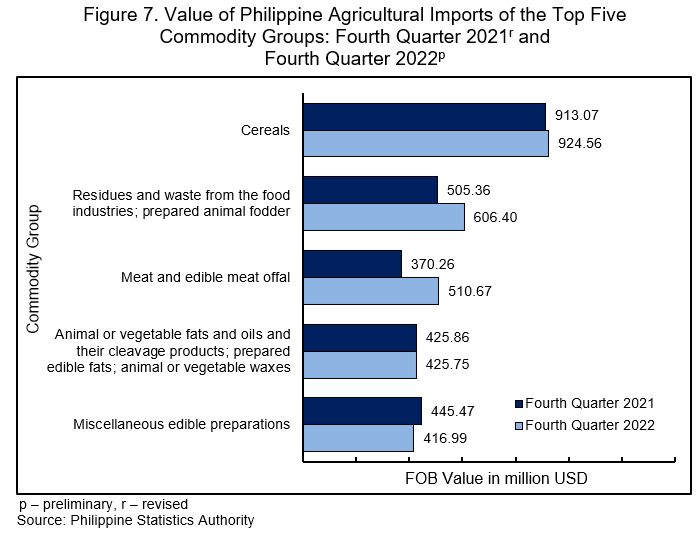
2. Cereals commodity group accounted for the highest value of agricultural imports
The top 10 commodity groups in terms of value of agricultural imports was valued at USD 4.06 billion or 85.1 percent of the total agricultural imports’ revenue in the fourth quarter of 2022. Moreover, the combined agricultural import value of these top 10 commodity groups posted an annual increment of 13.7 percent during the year relative to its same quarter value in 2021.
Among the major commodity groups, cereals accounted for the largest share worth USD 924.56 million or 19.4 percent of the total value of agricultural imports in the fourth quarter of 2022. (Figure 7 and Table 5)
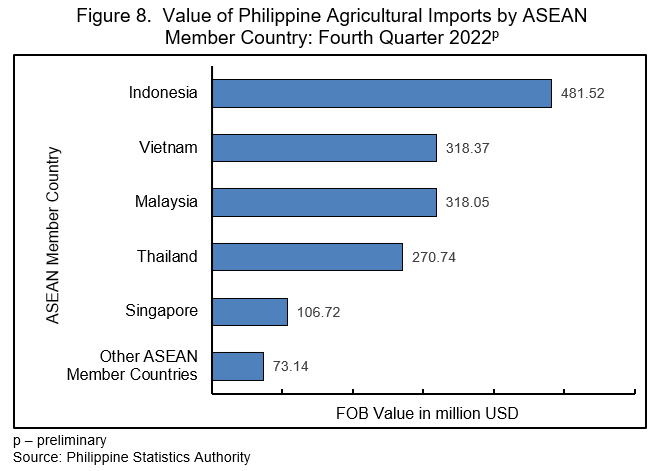
3. Indonesia reported the highest agricultural import value among ASEAN member countries
The country’s agricultural imports from ASEAN member countries in the fourth quarter of 2022 amounted to USD 1.57 billion or 17.0 percent of the country’s total imports. In terms of value, Indonesia was the major supplier of agricultural products to the Philippines among ASEAN member countries, contributing USD 481.52 million or 30.7 percent to the country’s total value of agricultural imports from ASEAN member countries in the fourth quarter of 2022. (Figure 8 and Table 8)
4. Animal or vegetable fats and oils and their cleavage products; prepared edible fats; animal or vegetable waxes commodity group was the top imported agricultural commodities from ASEAN member countries
The top three imported agricultural goods from ASEAN member countries in the fourth quarter of 2022 were:
a. animal or vegetable fats and oils and their cleavage products; prepared edible fats; animal or vegetable waxes, USD 392.76 million;
b. cereals, USD 304.63 million; and
c. miscellaneous edible preparations, USD 289.34 million. (Table 8)
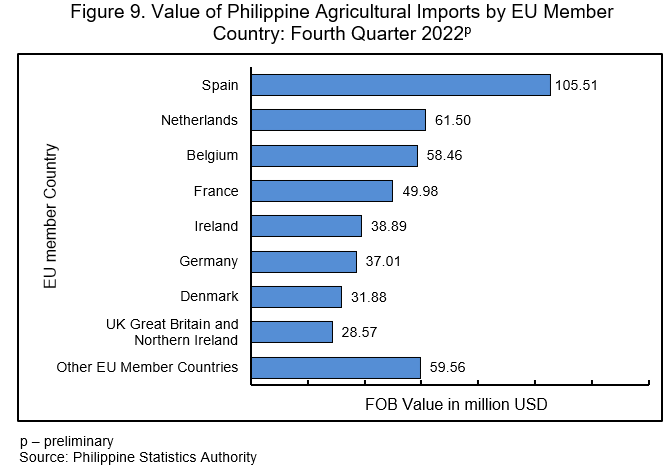
5. Spain topped EU member countries in agricultural imports
The country’s agricultural imports from EU member countries amounted to USD 471.36 million or a share of 23.3 percent to the total value of imports in the fourth quarter of 2022. Among EU member countries, Spain was the country’s top supplier of agricultural commodities with an import value of USD 105.51 million or a share of 22.4 percent to the country’s total value of agricultural imports from EU member countries. (Figure 9 and Table 10)
6. Meat and edible meat offal commodity group topped agricultural imports from EU member countries
The top three agricultural commodities imported from EU member countries in the fourth quarter of 2022 were:
a. meat and edible meat offal, USD 142.20 million;
b. dairy produce; birds’ eggs; natural honey; edible products of animal origin, not elsewhere classified, USD 97.73 million; and
c. beverages, spirits and vinegar, USD 54.70 million. (Table 10)
DIVINA GRACIA L. DEL PRADO, Ph.D.
(Assistant National Statistician)
Officer-in-Charge, Deputy National Statistician
Sectoral Statistics Office
| Attachment | Size |
|---|---|
|
|
2.4 MB |
|
|
207.44 KB |