
EXTERNAL TRADE PERFORMANCE
APRIL 2013
(Preliminary)
p-preliminary
r-revised

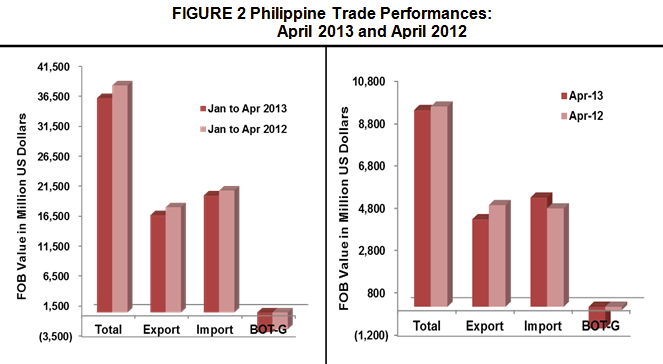
APRIL 2013 TOTAL TRADE STAND AT $9.263 BILLION
Total external trade in goods for April 2013 reached $9.263 billion, representing a 1.7 percent decline from $9.423 billion recorded during the same month in 2012. This was due to the 11.1 percent downward trend of total exports from $4.635 billion to $4.121 billion in April 2013. On the contrary, imports showed an increase of 7.4 percent to $5.141 billion from $4.788 billion in April 2012. Thus, the balance of trade in goods (BOT-G) for the Philippines in April 2013 registered a deficit of $1.020 billion from $153 million deficit in the same period last year.
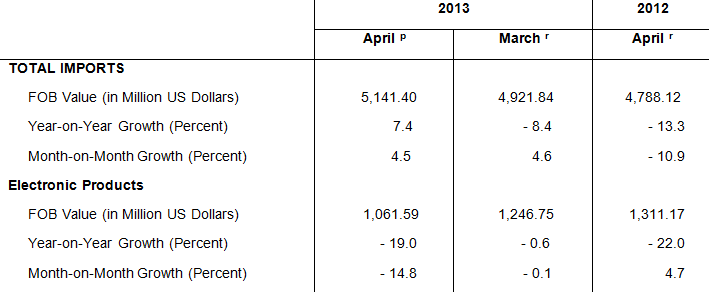
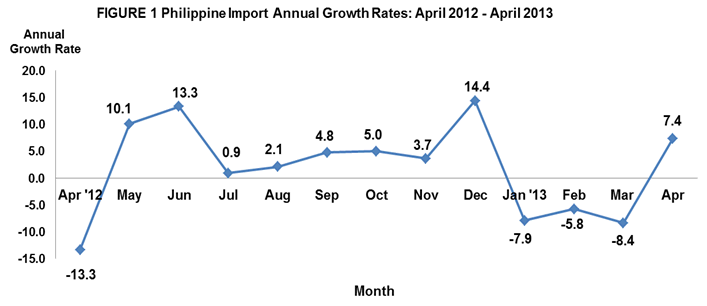
APRIL 2013 IMPORTS UP BY 7.4 PERCENT
The country’s total merchandise imports for this month went up by 7.4 percent to $5.141 billion in April 2013 from $4.788 billion in April 2012. Similarly, it increased by 4.5 percent from $4.922 billion compared to previous month’s level. The growth was supported by seven out of 10 major commodity groups whose year-on-year change was positive. These were as follows: transport equipment; medicinal and pharmaceutical products; mineral fuels, lubricants and related materials; other food and live animals; industrial machinery and equipment; organic and inorganic chemicals; and iron and steel. However, aggregate imports for the first four months of 2013 amounting to $19.498 billion showed a 3.9 percent decline compared with $20.297 billion in the same four months of last year.
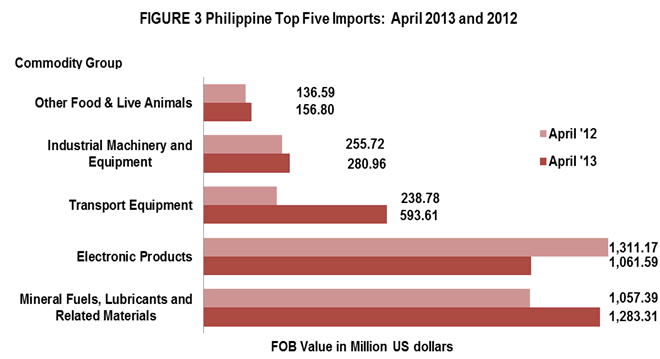
MINERAL FUELS, LUBRICANTS AND RELATED MATERIALS ACCOUNT FOR 25.0 PERCENT OF IMPORT BILL
Accounting for 25.0 percent of the aggregate import bill, Mineral Fuels, Lubricants and Related Materials was the top imported commodity in April 2013 with payments amounting to $1.283 billion. It went up by 21.4 percent over last year's figure of $1.057 billion. On a monthly basis, it grew by 23.3 percent from $1.040 billion recorded in March 2013. Volume of shipment of this product also went up by 61.2 percent compared to last year of same period.
Imports of Electronic Products ranked second with 20.6 percent share and posted a negative annual growth rate of 19.0 percent from reported value of $1.311 billion in April 2012 to $1.062 billion in April 2013. Among the major groups of electronic products, Components/Devices (Semiconductors), having the biggest share of 14.6 percent, decreased by 26.1 percent from $1.015 billion in April 2012 to $749.74 million in April 2013.
Transport Equipment was the PH’s third top import for the month with 11.5 percent share to total imports valued at $593.61 million in April 2013. This figure was 148.6 percent higher than the previous year’s level of $238.78 million and the highest annual growth rate among the top ten imports. The increase in value was caused by the purchase of an aircraft.
Industrial Machinery and Equipment, contributing 5.5 percent to the total import bill was the PH’s fourth top import for the month amounting to $280.96 million. It accelerated by 9.9 percent compared to last year’s value of $255.72 million. Likewise, the volume of shipment of this product rose by 21.1 percent compared with same period last year.
Fifth in rank and with 3.0 percent share to the total imports, Other Food and Live Animals recorded $156.80 million worth of imports, higher by 14.8 percent from its year ago level of $136.59 million. Inward shipments in terms of gross kilos registered a positive year-on-year change of 33.5 percent.
Rounding up the list of the top ten imports for April 2013 were Iron and Steel valued at $125.76 million; Organic and Inorganic Chemicals amounting to $117.52 million; Plastics in Primary and Non - Primary Forms, $116.53 million; Medicinal and Pharmaceutical Products, $103.24 million; and Telecommunication Equipment and Electrical Machinery, $97.25 million.
Aggregate payment for the country’s top ten imports for April 2013 reached $3.937 billion or 76.6 percent of the total import bill.
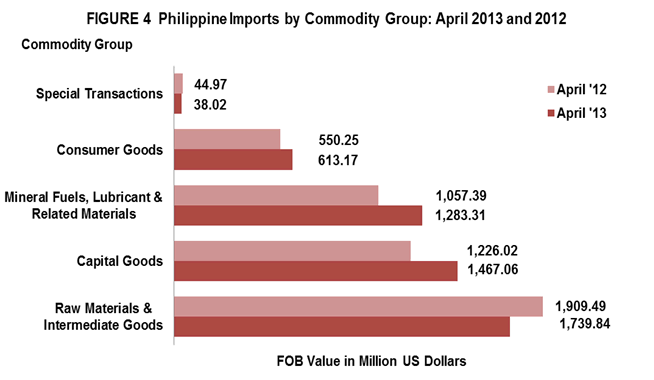
RAW MATERIALS AND INTERMEDIATE GOODS ACCOUNT FOR 33.8 PERCENT OF THE TOTAL IMPORTS
Accounting for 33.8 percent of the total imports, payments in April 2013 for Raw Materials and Intermediate Goods amounted to $1.740 billion or an 8.9 percent decrement over last year's figure of $1.909 billion. Compared to the previous month’s level, purchases also went down by 8.6 percent from $1.904 billion. Semi-Processed Raw Materials had the biggest share of 30.6 percent and valued at $1.575 billion. Similarly, volume of inward shipments of raw materials and intermediate goods and semi-processed raw materials dropped by 3.5 percent and 10.9 percent, respectively, compared with same month a year ago.
Capital Goods, which comprised 28.5 percent of the total imports, rose by 19.7 percent year-on-year to $1.467 billion from $1.226 billion. This was brought by 11.7 percent positive growth in volume of inward shipments for this month.
Mineral Fuels, Lubricants and Related Materials with 25.0 percent share to total imports expanded by 21.4 percent to $1.283 billion from $1.057 billion in April 2012. Likewise, volume of shipment of this product grew by 61.2 percent.
Purchases of Consumer Goods amounted to $613.17 million or an 11.4 percent growth from $550.25 million in April 2012 while Special Transactions went down by 15.4 percent from $44.97 million to $38.02 million in April 2013. However, in terms of volume of shipments, imports of consumer goods registered a positive growth of 16.3 percent and special transactions recorded a negative growth of 25.9 percent compared with same month last year.
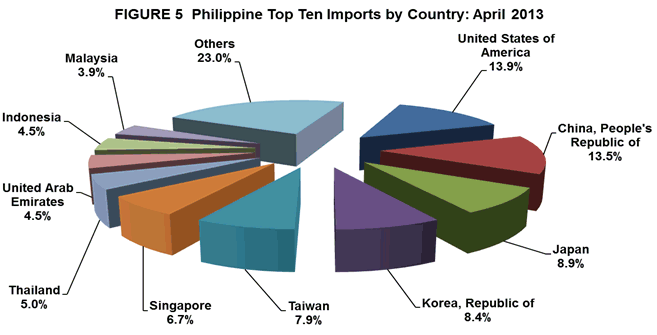
IMPORTS FROM UNITED STATES ACCOUNT FOR 13.9 PERCENT
United States of America (USA) including Alaska and Hawaii was the country’s biggest source of imports for April 2013 with 13.9 percent share of the total import bill, higher by 25.9 percent to $715.85 million from $568.42 million in April 2012. The increase was attributed to the purchase of an aircraft. Exports to USA amounted to $608.11 million, yielding a two-way trade value of $1.324 billion and a trade deficit for PH of $107.73 million.
People’s Republic of China was the second biggest source of imports with 13.5 percent share. Payments were recorded at $693.54 million, an increase of 47.0 percent from $471.90 million in April 2012. Commodities imported from China were mostly mineral products and electronic products. Revenue from PH’s exports to China, on the other hand, reached $456.58 million, generating a total trade value of $1.150 billion and $236.96 million trade deficit for the Philippines.
Japan including Okinawa came third, accounting for about 8.9 percent share of the total import bill in April 2013 with a negative growth of 17.7 percent from $552.84 million to $455.05 million. Electronic products, transport equipment and chemicals were the recorded imported goods from Japan. Exports to Japan amounted to $942.26 million resulting to a total trade value of $1.397 billion and a trade surplus of $487.21 million.
Republic of Korea settled fourth accounting for 8.4 percent share of the total import bill in April 2013 or an increase of 9.8 percent to $429.42 million from $390.99 million in April 2012. Commodities purchased from Korea in April 2013 were mineral products, electronic products and iron and steel. Exports to Republic of Korea amounted to $283.57 million resulting to a total trade value of $712.99 million and a trade deficit of $145.85 million.
Fifth in rank was Taiwan, representing a 7.9 percent of the total import bill in April 2013 amounting to $404.44 million. Mineral, fuels and lubricants and components/devices (semiconductors) were the imported goods from Taiwan. Meanwhile, export receipts from Taiwan in April 2013 reached $114.50 million yielding a total trade value of $518.94 million and a trade deficit of $289.94 million.
Other major sources of imports for the month of April 2013 were Singapore, $343.19 million; Thailand $258.27 million; United Arab Emirates, $230.20 million; Indonesia, $230.19 million; and Malaysia (including Sabah and Sarawak), $200.78 million.
Payments for imports from the top ten sources for April 2013 amounted to $3.961 billion or 77.0 percent of the total.
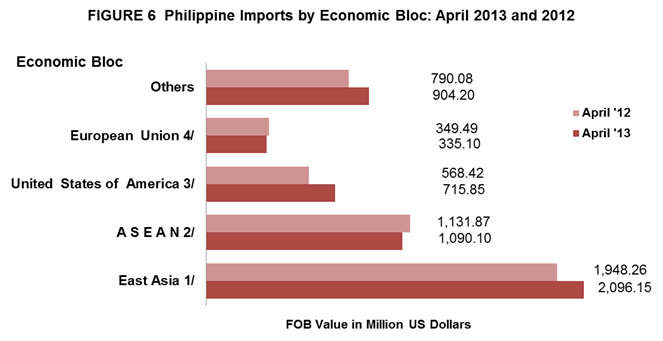
IMPORTS FROM EAST ASIA WORTH $2.096 BILLION
Philippines total imports in April 2013 with East Asia (China, Hong Kong, Japan, Macau, Mongolia, North Korea, South Korea and Taiwan) accounted for 40.8 percent of the county’s total imports with total payments of $2.096 billion or a positive annual growth of 7.6 percent from April 2012 level of $1.948 billion. Total exports to member-countries of East Asia were valued at $2.057 billion resulting to a total trade of $4.154 billion and a balance of trade in goods (BOT-G) deficit of $38.17 million.
Imports from ASEAN member-countries in April 2013 registered at $1.090 billion, contributed 21.2 percent share, lower by 3.7 percent from $1.132 billion registered in April 2012. Exports to ASEAN member-countries worth $722.77 million resulted to a total trade of $1.813 billion and a trade deficit of $367.33 million.
April 2013 imports from European Union were valued at $335.10 million. It contracted by 4.1 percent compared to a year ago recorded value of $349.49 million while exports to member-countries of European Union were worth $468.55 million. This aggregated to total trade of $803.64 million and a trade surplus of $133.45 million.
Notes:
1/ - includes China, Hong Kong, Japan, Macau, Mongolia, N, Korea, S. Korea, Taiwan
2/ - includes Brunei Darussalam, Cambodia, Indonesia, Laos, Malaysia, Myanmar, Singapore, Thailand, Vietnam
3/ - includes Alaska and Hawaii
4/ - includes Austria, Belgium, Bulgaria, Cyprus, Czech Republic, Denmark, Estonia, Finland, France, Germany,
Greece, Hungary, Ireland, Italy, Latvia, Lithuania, Luxembourg, Malta, Netherlands, Poland, Portugal,
Romania, Slovakia, Slovenia, Spain, Sweden and UK Great Britain
Technical Notes:
- Adjustments on electronic import statistics are based on the transactions that pass through the Electronic to Mobile (e2m) of the Bureau of Customs (BOC).
- Starting with the 2007 Press Release, analysis and tables are based on the 2004 Philippine Standard Commodity Classification (PSCC) groupings. This is in compliance with NSCB Resolution No. 03, Series of 2005 entitled “Approving and Adopting the 2004 Philippine Standard Commodity Classification” by all concerned government agencies and instrumentalities.
CARMELITA N. ERICTA
Administrator
Source: Foreign Trade Statistics Section
Industry and Trade Statistics Department
National Statistics Office
Manila, Philippines