
EXTERNAL TRADE PERFORMANCE
APRIL 2015
(Preliminary)
|
|
April
|
||
|---|---|---|---|
|
|
2015 p |
2014 r |
|
|
TOTAL IMPORTS FOB Value in Million US Dollars Year-on-Year Growth (Percent) Electronic Products FOB Value in Million US Dollars Year-on-Year Growth (Percent) |
4,677.27 -12.8
991.05 -5.1 |
5,365.82 4.1
1,044.69 -2.4 |
|
|
Top 10 Philippine Imports from All Countries: April 2015 p
(Year-on-Year Growth in Percent)
|
|||
|---|---|---|---|
Gainers |
Losers |
||
|
Cereals and Cereal Preparation
|
118.7 |
Mineral Fuels, Lubricants and Related Materials
|
-53.9 |
|
Power Generating and Specialized Machinery
|
54.3 |
Plastics in Primary and Non-Primary Forms
|
-26.1 |
|
Other Food and Live Animals
|
27.4 |
Iron and Steel
|
-23.9 |
|
Miscellaneous Manufactured Articles
|
19.6 |
Transport Equipment
|
-16.0 |
|
Industrial Machinery and Eqipment |
9.9 |
Electronic Products
|
-5.1 |
p-preliminary, r-revised
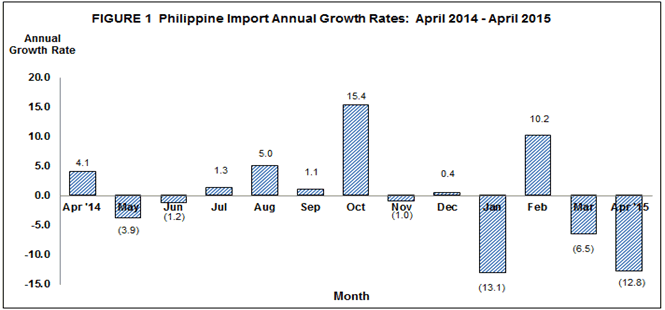
IMPORTS DECREASED BY 12.8 PERCENT IN APRIL 2015
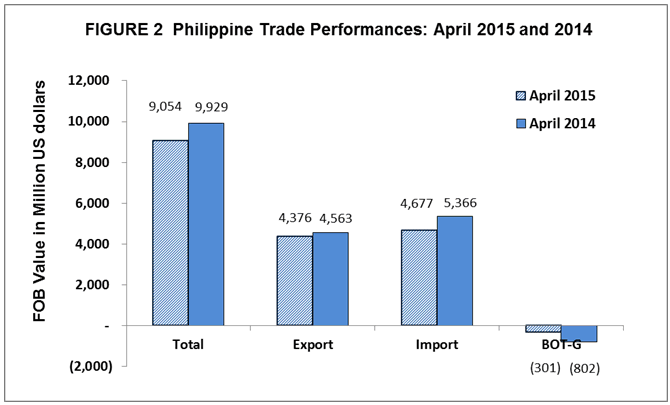
The total imported goods by the country for the month of April 2015 amounted to $4.677 billion, a decrease of 12.8 percent from $5.366 billion recorded during the same period a year ago. The decline in total imports for this period was due to the negative performance of five out of the top ten major commodities for the month. These were: Mineral Fuels, Lubricants and Related Materials; Plastics in Primary and Non-Primary Forms; Iron and Steel; Transport Equipment; and Electronic Products. Inward shipments of Mineral Fuels, Lubricants and Related Materials showed a remarkable 53.9 percent decrease (an equivalent of $773.20 million) relative to the previous year’s level.
Combined imports for the first four months of 2015 amounted to $20.377 billion, a 6.2 percent decrease compared with $21.713 billion in the same period of last year.
The balance of trade in goods (BOT-G) for the Philippines in April 2015 registered a deficit of $300.92 million compared to the $802.32 million deficit in the same period last year.
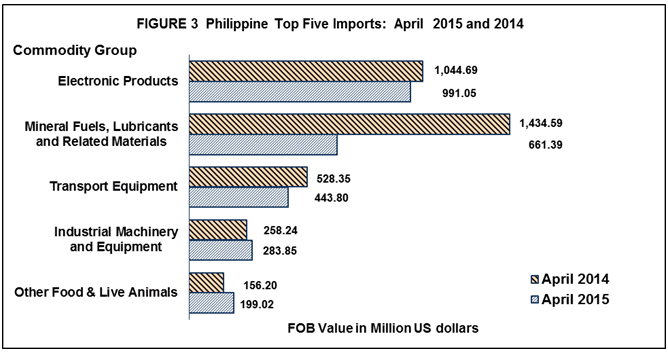
ELECTRONIC PRODUCTS ACCOUNTED FOR 21.2 PERCENT OF IMPORT BILL
Inward shipments of Electronic Products in April 2015, accounted for 21.2 percent of the total import bill with value amounting to $991.05 million. It contracted by 5.1 percent over last year's figure of $1.045 billion. Components/Devices (Semiconductors), although had biggest share of 13.9 percent among electronic products, decreased by 17.7 percent from $792.70 million in April 2014 to $652.33 million in April 2015.
Imports of Mineral Fuels, Lubricants and Related Materials ranked second with 14.1 percent share and reported value of $661.39 million in April 2015. It went down by 53.9 percent from $1.435 billion in April 2014.
Transport Equipment placed third with 9.5 percent share to total imports valued at $443.80 million. This recorded a decline of 16.0 percent from its previous year’s level of $528.35 million.
Industrial Machinery and Equipment, contributing 6.1 percent to the total import bill was the country’s fourth top import for the month amounting to $283.85 million. It went up by 9.9 percent compared to last year’s value of $258.24 million.
Fifth in rank and with 4.3 percent share to the total imports, Other Food and Live Animals recorded $199.02 million worth of imports. It registered a 27.4 percent increase from its year ago level of $156.20 million.
Rounding up the list of the top ten imports for April 2015 were: Cereals and Cereal Preparations valued at $194.30 million; Miscellaneous Manufactured Articles, $142.06 million; Plastics in Primary and Non-Primary Forms, $131.87 million; Power Generating and Specialized Machinery amounting to $127.22 million; and Iron and Steel, $118.95 million.
Total payment for the country’s top ten imports for April 2015 reached $3.294 billion or 70.4 percent of the total import bill.
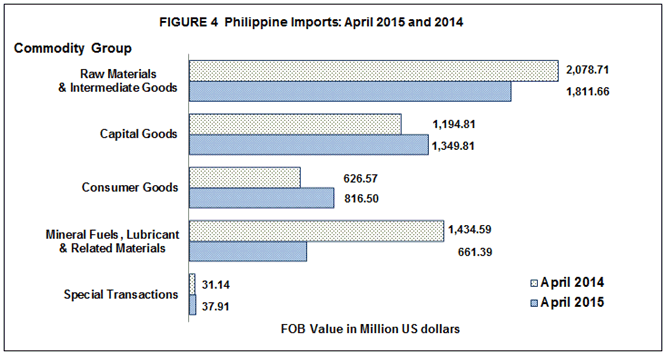
PURCHASES OF RAW MATERIALS AND INTERMEDIATE GOODS RECORDED AT 38.7 PERCENT OF THE TOTAL IMPORTS
Payments for purchases of Raw Materials and Intermediate Goods in April 2015 were valued at $1.812 billion and accounted for 38.7 percent of the total imports. It decreased by 12.8 percent over last year's figure of $2.079 billion. Semi-Processed Raw Materials had the biggest share of 34.9 percent valued at $1.631 billion and went down by 16.6 percent compared to $1.957 billion value in April 2014.
Payments for inward shipments of Capital Goods accounted for 28.9 percent of the total imports. It rose by 13.0 percent to $1.350 billion in April 2015 from $1.195 billion in April 2014.
Purchases of Consumer Goods recorded 17.5 percent share with a total import bill valued at $816.50 million in April 2015. It increased by 30.3 percent from $626.57 million registered in April 2014.
Mineral Fuels, Lubricants and Related Materials with 14.1 percent share to total imports, decreased by 53.9 percent from $1.435 billion in April 2014 to $661.39 million in April 2015. Other mineral fuel and lubricants such as gas oils, regular and premium unleaded motor spirit and aviation spirit contributed the biggest share of imports in this commodity group.
Special Transactions went up by 21.7 percent to $37.91 million in April 2015 from $31.14 million recorded in April 2014.
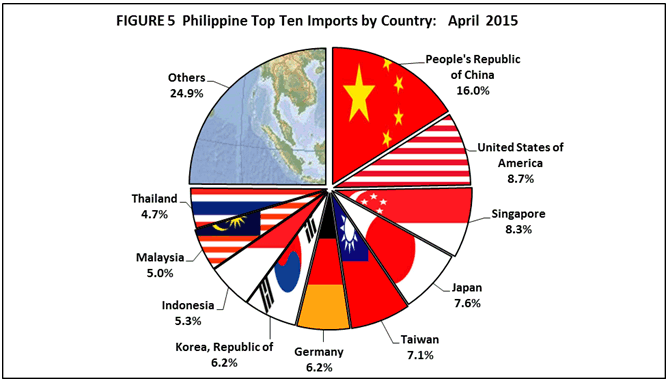
IMPORTS FROM PEOPLE’S REPUBLIC OF CHINA ACCOUNTED FOR 16.0 PERCENT
People’s Republic of China remained as the country’s biggest source of imports with 16.0 percent share in April 2015. Payments were recorded at $749.85 million, a decrease of 11.0 percent from $842.48 million in April 2014. Revenue from the country’s exports to China, on the other hand, reached $467.67 million, generating a total trade value of $1.218 billion and $282.19 million trade deficit.
United States of America (USA) including Alaska and Hawaii was the second biggest source of imports for April 2015 with 8.7 percent share to the total import bill amounting to $404.84 million which increased by 6.0 percent from $382.08 million in April 2014. Exports to USA amounted to $700.21 million, yielding a two-way trade value of $1.105 billion and a trade surplus of $295.37 million.
Singapore came third, contributing 8.3 percent to the total import bill in April 2015, valued at $388.91 million. It increased by 11.2 percent from its April 2014 value of $349.88 million. Export receipts from Singapore in April 2015 reached $260.16 million yielding a total trade value of $649.07 million and a trade deficit of $128.75 million.
Japan including Okinawa ranked fourth, accounting for 7.6 percent share of the total import bill in April 2015 with a negative growth of 13.5 percent from $408.68 million in April 2014 to $353.69 million in April 2015. Exports to this country amounted to $784.90 million resulting to a total trade value of $1.139 billion and a trade surplus of $431.20 million.
Fifth in rank was Taiwan accounting for 7.1 percent share of the total import bill worth $330.39 million in April 2015, a decrease by 5.8 percent from $350.74 million in April 2014. Exports to Taiwan amounted to $159.37 million resulting to a total trade value of $489.76 million and a trade deficit of $171.02 million.
Other major sources of imports for the month of April 2015 were: Germany, $291.39 million; Republic of Korea, $290.88 million; Indonesia, $248.75 million; Malaysia (includes Sabah and Sarawak), $232.81 million; and Thailand, $221.71 million.
Aggregate payments for imports from the top ten sources for April 2015 amounted to $3.513 billion or 75.1 percent of the total.
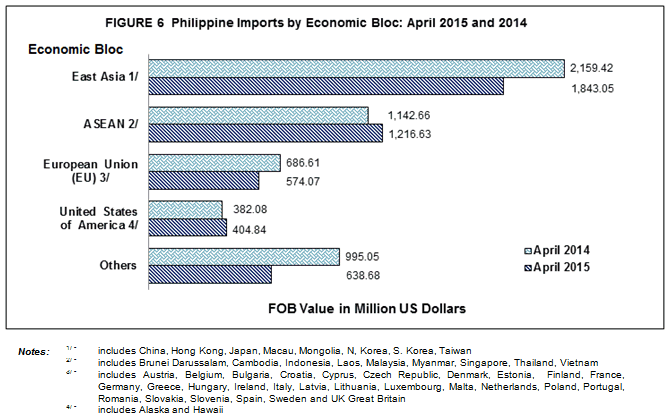
IMPORTS FROM COUNTRIES IN EAST ASIA ACCOUNTED FOR 39.4 PERCENT
By economic bloc, East Asia (China, Hong Kong, Japan, Macau, Mongolia, North Korea, South Korea and Taiwan) was the biggest source of the country’s imports in April 2015 as it accounted for 39.4 percent of the total imports valued at $1.843 billion. It decreased by 14.7 percent from $2.159 billion in April 2014. Total exports to countries of East Asia amounted to $2.097 billion resulting to a total trade of $3.940 billion and a trade surplus of $254.01 million.
Commodities imported from ASEAN member countries were valued at $1.217 billion, contributing 26.0 percent share and which increased by 6.5 percent from $1.143 billion recorded in April 2014. Proceeds from exports to ASEAN member countries were worth $594.95 million, resulting to a total trade of $1.812 billion and a trade deficit of $621.68 million.
Imports from European Union were valued at $574.07 million. It dropped by 16.4 percent compared to a year ago value of $686.61 million. Exports to member countries of European Union were worth $606.85 million, resulting to a total trade of $1.181 billion and a trade surplus of $32.78 million.
Technical Notes:
- Adjustments on electronic import statistics are based on the transactions that pass through the Electronic to Mobile (e2m) of the Bureau of Customs (BOC).
- Starting with the 2007 Press Release, analysis and tables are based on the 2004 Philippine Standard Commodity Classification (PSCC) groupings. This is in compliance with the former NSCB Resolution No. 03, Series of 2005 entitled “Approving and Adopting the 2004 Philippine Standard Commodity Classification” by all concerned government agencies and instrumentalities.
(Sgd.) LISA GRACE S. BERSALES, Ph. D.
National Statistician