
SUMMARY REPORT OF THE EXTERNAL TRADE PERFORMANCE FOR AUGUST 2000
(Preliminary)
JANUARY TO AUGUST BALANCE OF TRADE STANDS AT $3.710 BILLION
Total external trade in goods for January to August 2000 amounted to $45.020 billion which was 6.1 percent higher than $42.434 billion in 1999. Merchandise exports valued at $24.365 billion rose by 11.4 percent from $21.865 billion last year while total import went up by 0.4 percent to $20.655 billion from $20.569 billion a year ago. Balance of trade in goods (BOT-G) for the period stood at a surplus of $3.710 billion compared to $1.296 billion last year.
Fig. 1. Philippine Foreign Trade by Month: 2000
(F.O.B. Value in Million US Dollar)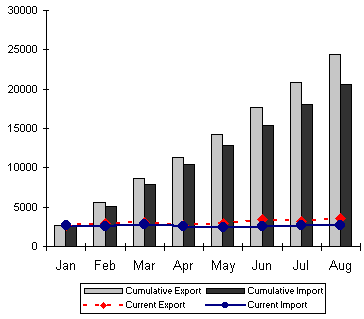
AUGUST IMPORTS DOWN BY 0.7 PERCENT
For the month of August, total merchandise trade valued at $6.172 billion posted a 5.1 percent increase from $5.873 billion last year. Receipts from exports went up by 9.9 percent to $3.529 billion from $3.212 billion last year, while payments for imports reached $2.643 billion or 0.7 percent lower than $2.661 billion in 1999. The balance of trade in goods was at a surplus of $887 million.
Fig. 2A. Philippine Trade Performance in January August : 2000 & 1999
(F.O.B. Value in Million US Dollar)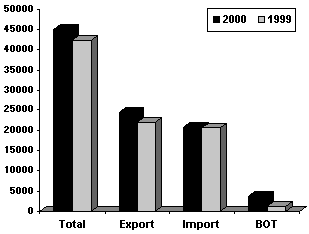
Fig. 2B. Philippine Trade Performance in August : 2000 & 1999
(F.O.B. Value in Million US Dollar)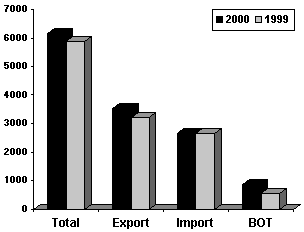
ELECTRONICS DOWN BY 26.5 PERCENT
Still the top import with a 19.1 percent share, payments for Electronics Components amounting to $505.55 million declined by 26.5 percent from $687.94 million last year.
Telecommunication Equipment and Electrical Machinery with a 10.6 percent share of the total bill ranked second with payments of $280.41 million. This was a 51.6 percent increase from $184.94 million last year.
Purchases of Mineral Fuels, Lubricants and Related Materials followed with a 10.4 percent share. Import bills amounted to $275.81 million or 25.7 percent higher than $219.35 million in 1999.
Fourth top import for the month consisted of Industrial Machinery and Equipment with a 6.1 percent share of the total. Payments went down by 3.4 percent to $162.26 million from $168.07 million the previous year.
Office and EDP Machines accounting for 5.8 percent of the total went up by 17.2 percent to $153.97 million from $131.43 million in 1999.
Transport Equipment comprised the sixth top import group. Accounting for 4.6 percent of the total bill, payments reached $121.34 million which was 30.2 percent higher than $93.17 million a year earlier.
Rounding-up the list of the top imports for August 2000 were: Materials/Accessories Imported on Consignment Basis for the Manufacture of Other Electrical and Electronic Machinery and Equipment, $109.49 million; Textile Yarn, Fabrics, Made-up Articles and Related Products, $89.43 million; Power Generating and Specialized Machinery, $85.53 million; and, Iron and Steel, $70.70 million.
Aggregate payment for the top ten imports for the month amounted to $1.854 billion, or 70.2 percent of the total.
Fig. 3. Philippine Top Imports in August: 2000 & 1999
(F.O.B. Value in Million US Dollar)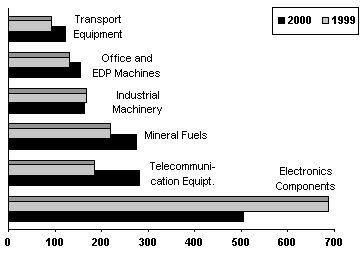
MINERAL FUELS GROW BY 25.7 PERCENT
Capital Goods led by Telecommunication Equipment and Electrical Machinery, accounted for 39.7 percent of the import bill as payments rose by 5.6 percent to $1.050 billion from $994.25 million a year ago.
With a 39.3 percent share, Raw Materials and Intermediate Goods consisting of unprocessed and semi-processed raw materials reported purchases amounting to $1.037 billion which was 7.0 percent lower than $1.116 billion last year.
Purchases of Mineral Fuels and Lubricants amounted to $275.81 million, which was 25.7 percent higher than $219.35 million in 1999.
Expenditures for Consumer Goods went up by 4.2 percent to $221.85 million while payments for Special Transactions dropped by 52.0 percent to $57.15 million.
Fig. 4. Philippine Imports by Major Type of Goods in August: 2000 & 1999
(F.O.B. Value in Million US Dollar)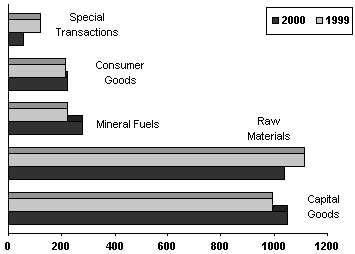
JAPAN CORNERS 20.3 PERCENT OF THE IMPORT BILL
Purchases from Japan with a 20.3 percent share of the total import bill increased by 9.6 percent to $537.27 million from $490.01 million last year. Exports to Japan on the other hand amounted to $463.02 million yielding a two-way trade figure of $1.0 billion and a BOT-G deficit of $74.25 million.
USA, the second biggest source of imports for the month with a 16.6 percent share, reporting sales of $438.40 million against purchases amounting to $1.078 billion. Total trade reached $1.516 billion and the BOT-G surplus stood at $639.22 million.
The third biggest source of imports was Taiwan. Expenditures for imports amounted to $192.43 million while revenue from exports reached $298.49 million resulting in a two-way trade value of $490.93 million and a $106.06 million BOT-G surplus.
Other major sources of imports for August 2000 were: Singapore, $181.64 million; Republic of Korea, $162.20 million; Saudi Arabia, $127.35 million; Hongkong, $107.94 million; Malaysia, $92.07 million; Thailand, $77.35 million; and Germany, $74.45 million.
Payments for imports from the top ten sources amounted to $1.991 billion or 75.3 percent of the total.
Fig. 5. Philippine Imports by Country in August: 2000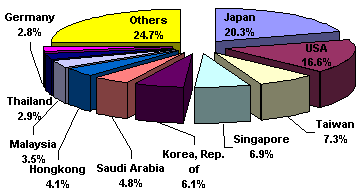
UNCOLLECTED DOCUMENTS
As of presstime 82 out of 62,705 export documents and 77 out of 57,744 import documents are still expected from the ports.
Source: National Statistics Office
Manila, Philippines