
EXTERNAL TRADE PERFORMANCE
AUGUST 2014
(Preliminary)
|
|
August
|
||
|---|---|---|---|
|
|
2014 p |
2013 r |
|
|
TOTAL IMPORTS FOB Value in Million US Dollars Year-on-Year Growth (Percent) Electronic Products FOB Value in Million US Dollars Year-on-Year Growth (Percent) |
5,490.98 -1.3
1,135.05 - 15.4 |
5,563.84 7.3
1,341.24 - 8.9 |
|
|
Top 10 Philippine Imports from All Countries: August 2014 p
(Year-on-Year Growth in Percent)
|
|||
|---|---|---|---|
Gainers |
Losers |
||
|
Cereals and Cereal Preparations
|
86.1 |
Electronic Products
|
-15.4 |
|
Other Food and Live Animals
|
26.6 |
Mineral Fuels, Lubricants and Related Materials
|
-2.6 |
| Miscellaneous Manufactured Articles | 24.6 | ||
| Iron and Steel | 23.7 | ||
| Transport Equipment | 22.4 | ||
|
Plastics in Primary and Non-Primary Forms
|
19.3 |
|
|
|
Telecommunication Equipment and Electrical Machinery
|
9.5 |
|
|
|
Industrial Machinery and Equipment
|
3.2 | ||
p-preliminary, r-revised
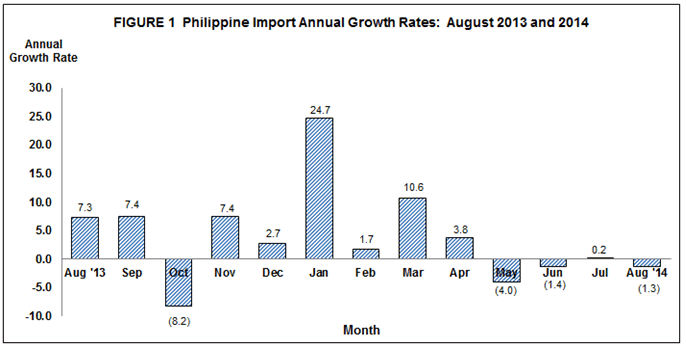
AUGUST 2014 IMPORTS DOWN BY 1.3 PERCENT
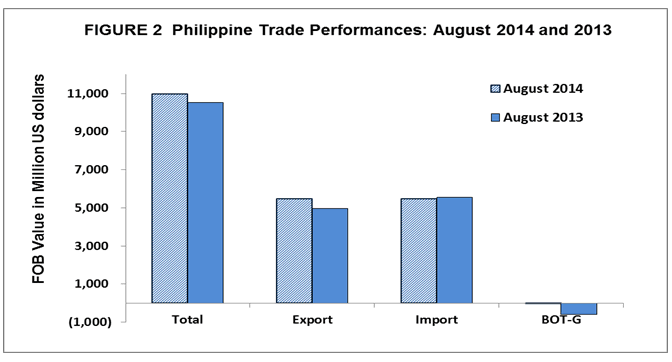
In August of 2014, Philippine’s total external trade in goods reached $5.491 billion, a 1.3 percent decrease from the $5.564 billion value recorded in August of 2013. The decrease in total imports for this period was due to the negative performance of two out of the top ten major commodities for the month. These were: electronic products; and mineral fuels, lubricants and related materials.
The cumulative imports for the eight month period of 2014 amounted to $42.446 billion, showing a 4.0 percent increase over the $40.810 billion recorded in the same period of last year.
The balance of trade in goods (BOT-G) for the Philippines in August 2014 registered a trade deficit of $17 million but narrowed by $591 million from the $608 million deficit in the same period last year.
MINERAL FUELS, LUBRICANTS AND RELATED MATERIALS ACCOUNT FOR 23.0 PERCENT OF IMPORT BILL
Inbound shipments of Mineral Fuels, Lubricants and Related Materials were the top imported commodities in August 2014, accounting for 23.0 percent of the total import bill and value amounting to $1.263 billion. It decreased by 2.6 percent over last year's figure of $1.296 billion.
Imports of Electronic Products ranked second, with 20.7 percent share and reported value of $1.135 billion in August 2014. It decelerated by 15.4 percent from $1.341 billion in August 2013. By major groups of electronic products, Components/Devices (Semiconductors) had the biggest share of 15.1 percent among electronic products but decreased by 20.6 percent from $1.047 billion in August 2013 compared to $830.99 million in August 2014.
Transport Equipment placed third with 10.2 percent share to total imports valued at $559.06 million. It increased by 22.4 percent from its year ago level of $456.60 million.
Industrial Machinery and Equipment, contributing 5.0 percent to the total import bill was the country’s fourth top import for the month amounting to $276.93 million. It rose by 3.2 percent compared to last year’s value of $268.21 million.
Fifth in rank were Other Food and Live Animals, with a 3.4 percent share to the total imports which valued at $188.07 million. It accelerated by 26.6 percent from previous year’s level of $148.56 million.
Rounding up the list of the top ten imports for August 2014 were: Plastics in Primary and Non-Primary Forms valued at $162.19 million; Iron and Steel, $155.65 million; Cereals and Cereal Preparations with $154.41 million and recorded the highest increase of 86.1 percent among the top ten imports; Miscellaneous Manufactured Articles amounting to $144.57 million; and Telecommunication Equipment and Electrical Machinery, $112.77 million.
Total payments for the country’s top ten imports for August 2014 reached $4.152 billion or 75.6 percent of the total import bill.

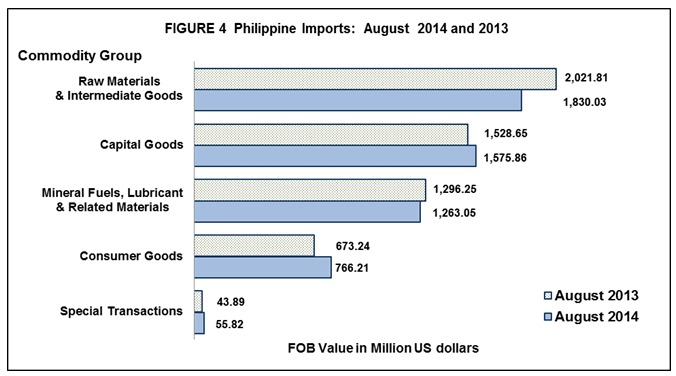
ONE-THIRD (33.3%) OF THE TOTAL IMPORTS ARE RAW MATERIALS AND INTERMEDIATE GOODS
Total payments for inward shipments of Raw Materials and Intermediate Goods in August 2014 was valued at $1.830 billion and accounted for 33.3 percent of the total imports. It decreased by 9.5 percent over last year's figure of $2.022 billion. Semi-Processed Raw Materials had the biggest share of 31.1 percent valued at $1.709 billion.
Purchases for Capital Goods accounted for 28.7 percent of the total imports. It accelerated by 3.1 percent to $1.576 billion in August 2014 from $1.529 billion in August 2013.
Mineral Fuels, Lubricants and Related Materials with 23.0 percent share to total imports, decreased by 2.6 percent from $1.296 billion in August 2013 to $1.263 billion in August 2014. Petroleum crude contributed the biggest share of imports in this commodity group by 11.2 percent.
Consumer Goods recorded a 14.0 percent share to total import bill valued at $766.21 million in August 2014. It increased by 13.8 percent from $673.24 million registered in August 2013.
Special Transactions increased by 27.2 percent to $55.82 million from $43.89 million in August 2014.
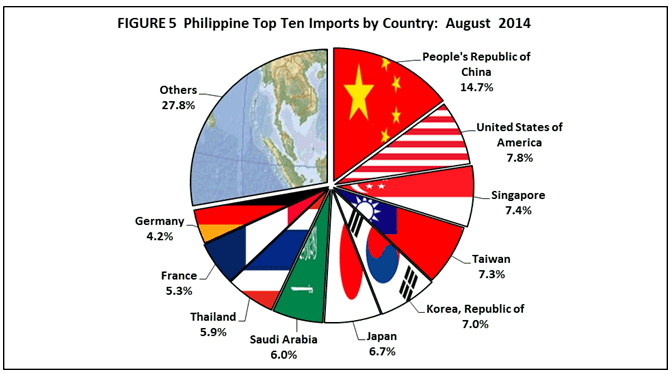
IMPORTS FROM PEOPLE’S REPUBLIC OF CHINA ACCOUNTS FOR 14.7 PERCENT
The principal source of imports in August 2014 was People’s Republic of China, accounting for 14.7 percent of the total overseas purchases. Payments were valued at $806.52 million, increased by 8.9 percent from $740.58 million in August 2013. Revenue from country’s exports to China reached $820.74 million, generating a total trade value of $1.627 billion and $14.22 million trade surplus.
United States of America (USA) including Alaska and Hawaii ranked second, accounting for 7.8 percent share of the total import bill in August 2014 with a downward performance of 18.2 percent from $524.23 million to $428.79 million in August 2014. Exports to this country amounted to $799.62 million resulting to a total trade value of $1.228 billion and a trade surplus of $370.83 million.
Singapore came third, contributing 7.4 percent of the total import bill in August 2014, with import value of $406.37 million. Export receipts from Singapore in August 2014 reached $405.67 million yielding a total trade value of $812.04 million and a trade deficit of $0.70 million.
Taiwan was the fourth biggest source of imports for August 2014 with 7.3 percent share to the total import bill amounting to $403.24 million and decreased by 14.3 percent from $470.72 million in August 2013. Exports to Taiwan amounted to $183.65 million, yielding a two-way trade value of $586.89 million and a trade deficit of $219.59 million.
Fifth in rank was Republic of Korea, accounting for 7.0 percent share of the total import bill valued at $383.13 million, grew by 23.0 percent from $311.49 million compared to same period last year. Exports to Republic of Korea amounted to $172.65 million resulting to a total trade value of $555.78 million and a trade deficit of $210.48 million.
The country’s other major sources of imports for the period were: Japan
including Okinawa, $366.81 million; Saudi Arabia, $327.78 million; Thailand, $321.24 million; France, $292.12 million; and Germany, $228.05 million.
Total payments for imports from the top ten sources for August 2014 amounted to $3.964 billion or 72.2 percent of the total.
EAST ASIA ACCOUNTS FOR 39.0 PERCENT OF THE TOTAL IMPORTS
East Asia (China, Hong Kong, Japan, Macau, Mongolia, North Korea, South Korea and Taiwan) was the biggest source of the country’s imports in August 2014 as it accounted for 39.0 percent of the total imports valued at $2.139 billion. It increased by 2.0 percent from $2.098 billion in August 2013. Total exports to member countries of East Asia amounted to $2.708 billion resulting to a total trade of $4.847 billion and a trade surplus of $569.40 million.
Goods imported from ASEAN member countries were valued at $1.269 billion, contributing 23.1 percent share and increased by 18.2 percent from $1.073 billion recorded in August 2013. Sales from exports to ASEAN member countries were worth $773.34 million, resulting to a total trade of $2.042 billion and a trade deficit of $495.23 million.
Imports from European Union amounted to $709.84 million. It increased by 21.1 percent compared to a year ago value of $585.95 million. Exports to member countries of European Union were worth $692.73 million, resulting to a total trade of $1.403 billion and a trade deficit of $17.12 million.

Technical Note:
Starting with the March 2007 Press Release, analysis and tables are based on the 2004 Philippine Standard Commodity Classification (PSCC) groupings. This is in compliance with NSCB Resolution No. 03, Series of 2005 entitled “Approving and Adopting the 2004 Philippine Standard Commodity Classification” by all concerned government agencies and instrumentalities.