
EXTERNAL TRADE PERFORMANCE
AUGUST 2015
(Preliminary)
|
|
August
|
||
|---|---|---|---|
|
|
2015 p |
2014 r |
|
|
TOTAL IMPORTS FOB Value in Million US Dollars Year-on-Year Growth (Percent) Electronic Products FOB Value in Million US Dollars Year-on-Year Growth (Percent) |
6,081.81 4.1
2,052.17 68.5 |
5,844.51 5.0
1,217.76 -9.2 |
|
|
Top 10 Philippine Imports from All Countries: August 2015 p
(Year-on-Year Growth in Percent)
|
|||
|---|---|---|---|
Gainers |
Losers |
||
|
Medicinal and Pharmaceutical Products
|
98.8 |
Mineral Fuels, Lubricants and Related Materials
|
-49.7 |
|
Electronic Products
|
68.5 |
Plastics in Primary and Non-Primary Forms
|
-22.4 |
|
Miscellaneous Manufactured Articles
|
17.4 |
Transport Equipment
|
-17.8 |
|
Industrial Machinery and Equipment
|
16.0 |
Iron and Steel
|
-9.8 |
|
Other Food and Live Animals |
10.3 |
Cereals and Cereal Preparations
|
-8.8 |
p-preliminary, r-revised
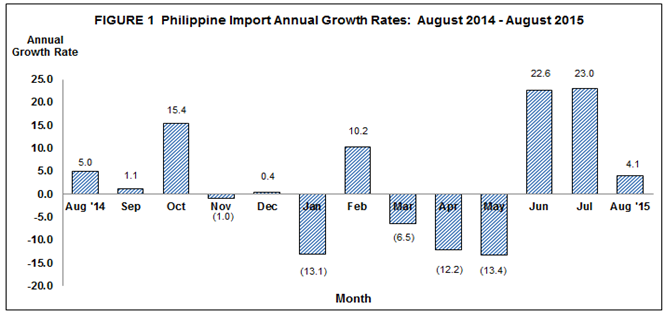
IMPORTS INCREASED BY 4.1 PERCENT IN AUGUST 2015
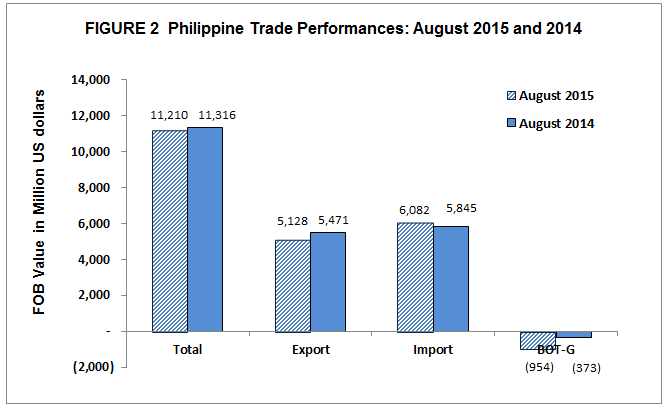
The total imported goods by the country for the month of August 2015 amounted to $6.082 billion, an increase of 4.1 percent from $5.845 billion recorded during the same period a year ago. This increase was due to the positive performance of five out of the top ten major imported commodities for the month. These were: Medicinal and Pharmaceutical Products; Electronic Products; Miscellaneous Manufactured Articles; Industrial Machinery and Equipment; and Other Food & Live Animals.
Combined imports for the eight month period of 2015 amounted to $43.651 billion, a 1.5 percent increase compared with $43.020 billion in the same period of last year.
The balance of trade in goods (BOT-G) for the Philippines in August 2015 registered a deficit of $953.89 million, higher than the $373.28 million deficit in the same period last year.
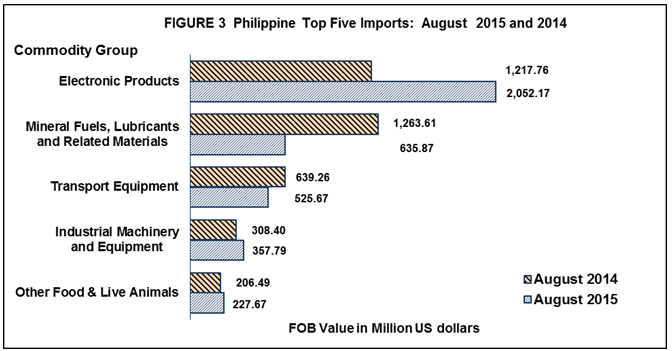
ELECTRONIC PRODUCTS ACCOUNTED FOR 33.7 PERCENT OF IMPORT BILL
Inbound shipments of Electronic Products in August 2015 accounted for 33.7 percent of the total import bill with value amounting to $2.052 billion. It rose by 68.5 percent over last year's figure of $1.218 billion. Components/Devices (Semiconductors), had the biggest share at 27.9 percent among electronic products and increased by 91.6 percent to $1.696 billion in August 2015 from $885.15 million in August 2014.
Minerals Fuels, Lubricants and Related Materials placed second with 10.5 percent share to total imports valued at $635.87 million. This registered a decrease of 49.7 percent from its previous year’s level of $1.264 billion.
Transport Equipment, contributing 8.6 percent to the total import bill was the country’s third top import for the month amounting to $525.67 million. It went down by 17.8 percent compared to last year’s value of $639.26 million.
Imports of Industrial Machinery and Equipment ranked fourth with 5.9 percent share and reported value of $357.79 million in August 2015. It grew by 16.0 percent from $308.40 million in August 2014.
Other Food and Live Animals which was fifth in rank and with 3.7 percent share to the total imports, recorded $227.67 million worth of imports. It registered a 10.3 percent increment from its year ago level of $206.49 million.
Rounding up the list of the top ten imports for August 2015 were: Miscellaneous Manufactured Articles valued at $179.86 million; Iron and Steel, $154.49 million; Cereals and Cereal Preparations, $143.27 million; Medicinal and Pharmaceutical Products, $140.03 million; and Plastics in Primary and Non – Primary Forms, $135.35 million.
Total payment for the country’s top ten imports for August 2015 reached $4.552 billion or 74.8 percent of the total import bill.
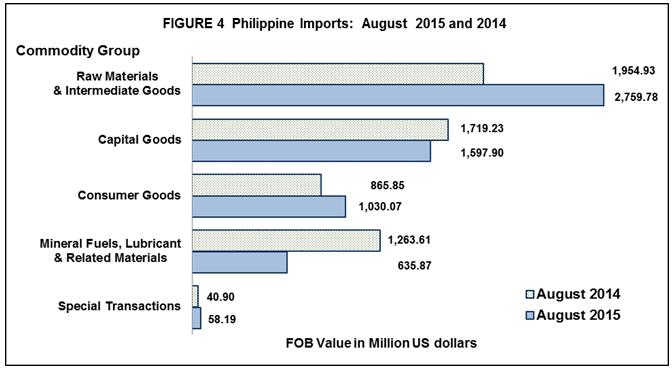
PURCHASES OF RAW MATERIALS AND INTERMEDIATE GOODS RECORDED AT 45.4 PERCENT OF THE TOTAL IMPORTS
Payments for purchases of Raw Materials and Intermediate Goods in August 2015 were valued at $2.760 billion and accounted for 45.4 percent of the total imports. It increased by 41.2 percent over last year's figure of $1.955 billion. Semi-Processed Raw Materials had the biggest share of 42.8 percent valued at $2.604 billion and went up by 42.6 percent compared to $1.826 billion value in August 2014.
Payments for inward shipments of Capital Goods accounted for 26.3 percent of the total imports. It declined by 7.1 percent from $1.719 billion in August 2014 to $1.598 billion in August 2015.
Purchases of Consumer Goods recorded 16.9 percent share with a total import bill valued at $1.030 billion in August 2015. It recorded a positive growth of 19.0 percent from $865.85 million registered in August 2014.
Mineral Fuels, Lubricants and Related Materials with 10.5 percent share to total imports, decreased by 49.7 percent from $1.264 billion in August 2014 to $635.87 million in August 2015. Petroleum crude contributed the biggest share of imports in this commodity group.
Special Transactions went up by 42.3 percent, that is, from $40.90 million recorded in August 2014 to $58.19 million in August 2015.
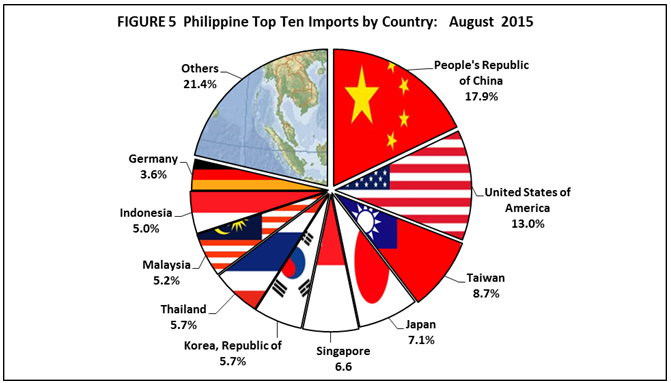
IMPORTS FROM PEOPLE’S REPUBLIC OF CHINA ACCOUNTED FOR 17.9 PERCENT
People’s Republic of China remained as the country’s biggest source of imports at 17.9 percent share in August 2015. Payments were recorded at $1.088 billion, an increase of 24.9 percent from $871.29 million in August 2014. Revenue from the country’s exports to China, on the other hand, reached $627.81 million, generating a total trade value of $1.716 billion and $460.05 million trade deficit.
United States of America (USA) including Alaska and Hawaii was the second biggest source of imports for August 2015 with 13.0 percent share to the total import bill amounting to $792.01 million, a positive growth of 75.0 percent from $452.59 million in August 2014. Exports to USA amounted to $766.37 million, yielding a two-way trade value of $1.558 billion and a trade deficit of $25.64 million.
Taiwan came third, contributing 8.7 percent or $528.72 million to the total import bill in August 2015. It grew by 27.6 percent from its August 2014 value of $414.35 million. Export receipts from Taiwan in August 2015 reached $156.08 million yielding a total trade value of $684.80 million and a trade deficit of $372.65 million.
Japan including Okinawa ranked fourth, accounting for 7.1 percent share of the total import bill in August 2015 had a positive increase of 6.9 percent to $434.18 million in August 2015 from $406.18 million in August 2014. Exports to this country amounted to $1.028 billion resulting to a total trade value of $1.462 billion and a trade surplus of $593.42 million.
Fifth in rank was Singapore accounting for 6.6 percent share of the total import bill worth $399.10 million in August 2015, a decrease of 5.5 percent from $422.36 million in August 2014. Exports to Singapore amounted to $353.47 million resulting to a total trade value of $752.56 million and a trade deficit of $45.63 million.
Other major sources of imports for the month of August 2015 were: Republic of Korea, $349.03 million; Thailand, $348.81 million; Malaysia (includes Sabah and Sarawak), $317.92 million; Indonesia, $303.17 million; and Germany, $221.64 million.
Aggregate payments for imports from the top ten sources for August 2015 amounted to $4.782 billion or 78.6 percent of the total.
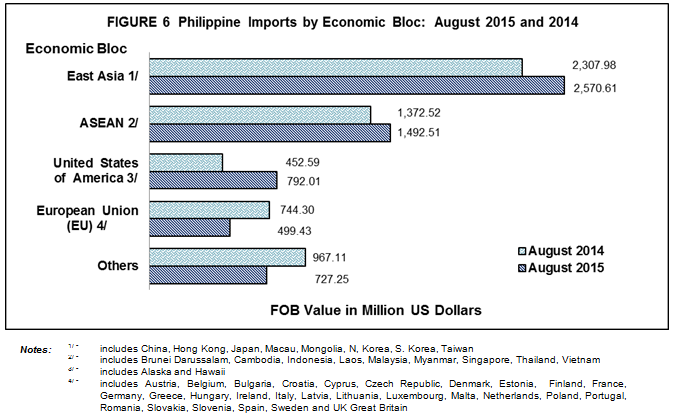
IMPORTS FROM COUNTRIES IN EAST ASIA ACCOUNTED FOR 42.3 PERCENT
By economic bloc, East Asia (China, Hong Kong, Japan, Macau, Mongolia, North Korea, South Korea and Taiwan) was the biggest source of the country’s imports in August 2015 as it accounted for 42.3 percent of the total imports valued at $2.571 billion. It increased by 11.4 percent from $2.308 billion in August 2014. Total exports to countries of East Asia amounted to $2.538 billion resulting to a total trade of $5.109 billion and a trade deficit of $32.52 million.
Commodities imported from ASEAN member countries were valued at $1.493 billion, contributing 24.5 percent share to total and registered an increment of 8.7 percent from $1.373 billion recorded in August 2014. Proceeds from exports to ASEAN member countries were worth $749.22 million, resulting to a total trade of $2.242 billion and a trade deficit of $743.29 million.
Imports from European Union were valued at $499.43 million. It dropped by 32.9 percent compared to a year ago value of $744.30 million. Exports to member countries of European Union were worth $618.71 million, resulting to a total trade of $1.118 billion and a trade surplus of $119.28 million.
Technical Notes:
1. Adjustments on electronic import statistics are based on the transactions that pass through the Electronic to Mobile (e2m) of the Bureau of Customs (BOC).
2. Starting with the 2007 Press Release, analysis and tables are based on the 2004 Philippine Standard Commodity Classification (PSCC) groupings. This is in compliance with the former NSCB Resolution No. 03, Series of 2005 entitled “Approving and Adopting the 2004 Philippine Standard Commodity Classification” by all concerned government agencies and instrumentalities.
FOR THE NATIONAL STATISTICIAN: