
|
|||||||||||||||||||||||||||||||||||||||||||||||
|
|
|||
|
Top 10 Philippine Imports from All Countries: December 2004 |
|||
|
Gainers |
Losers |
||
|
Organic and Inorganic Chemical |
72.4 |
Electronic Products |
-17.4 |
|
Miscellaneous Manufactured Articles |
44.1 |
Industrial Machinery and Equipment |
-17.2 |
|
Mineral Fuels, Lubricants and Related Materials |
29.7 |
Textile Yarn, Fabrics, Made-up Articles and Related Products |
-2.5 |
|
Transport Equipment |
25.5 |
|
|
|
Plastics in Primary and Non-Primary Forms |
22.4 |
|
|
|
Telecommunication Equipment and Electrical Machinery |
8.9 |
|
|
|
Iron and Steel |
0.4 |
|
|
January to December total trade stands at $79.90 billion
Total external trade in goods for January to December 2004 amounted to $79.90 billion representing a growth of 8.4 percent from $73.728 billion during the same period a year earlier. Total foreign-made merchandise also grew by 7.5 percent to $40.300 billion from $37.497 billion. Likewise, exports registered a year-on-year increment of 9.3 percent to aggregate dollar revenue of $39.598 billion from $36.231 billion last year. Balance of trade in goods (BOT-G) deficit for the Philippines reached $702 million, lower than last year’s deficit of $1.265 billion.
Figure 1A. Philippine Trade Performance in January - December :2003 and 2004
(F.O.B. Value in Million US Dollar)
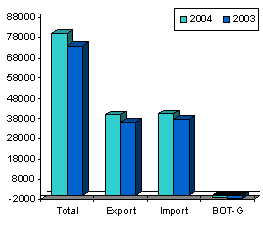
Figure 1B. Philippine Trade Performance in December :2003 - 2004
(F.O.B. Value in Million US Dollar)
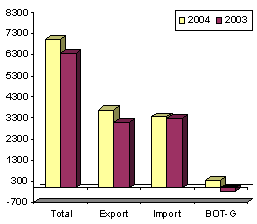
December imports register 0.9 percent decrease
Total merchandise trade for December 2004 inched up by 1.0 percent to $6.313 billion from $6.247 billion during the same period a year ago. Dollar-inflow generated by exports amounted to $3.268 billion, or 2.9 percent higher than last year’s $3.175 billion. On the other hand, expenditures for imported goods declined by 0.9 percent to $3.045 billion from $3.072 billion. The balance of trade in goods (BOT-G) registered a surplus at $223 million, higher compared to last year’s surplus of $103 million.
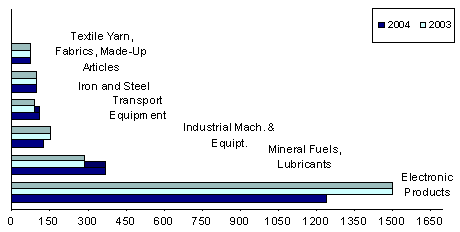
Electronic products account for 40.7 percent of import bill
Accounting for 40.7 percent of the total aggregate import bill, payments for electronic products amounted to $1.239 billion or a 17.4 percent drop over last year’s figure of $1.501 billion. Compared to the previous month’s level, purchases fell by 15.7 percent from $1.470 billion. Total annual payments for electronic products for 2004 was $17.715 billion. It registered an increase of 1.5 percent over the 2003 spending.
Imports of mineral fuels, lubricants and related materials in December ranked second with 12.1 percent share. Expenditures at $369.70 million, posted a 29.7 percent growth over the previous year’s level of $285.02 million.
Industrial machinery and equipment, the third top import was worth $124.55 million, or a reduction of 17.2 percent from $150.47 million a year earlier.
Transport equipment, accounting for 3.7 percent of the total imports, ranked fourth as foreign bill amounted to $111.53 million, an incease of 25.5 percent from $88.89 million last year.
Iron and steel, contributing 3.1 percent to the total bill, was RP’s fifth top import for the month with payments placed at $94.92 million or a climb of 0.4 percent from last year’s $94.59 million.
Expenditures for textile yarn, fabrics, made-up articles and related products, with a 2.4 percent share to the aggregate bill, went down by 2.5 percent to $73.52 million from $75.40 million in December 2003.
Rounding up the list of the top imports for December 2004 were telecommunication equipment and electrical machinery, $72.30 million; organic and inorganic chemical, $66.59 million; plastics in primary and non-primary forms, $64.52 million; and miscellaneous manufactured articles, $52.40 million.
Aggregate payment for the country’s top ten imports for December 2004 reached to $2.269 billion or 74.5 percent of the total bill.
Figure 2. Philippine Top Imports in December 2003 and 2004
(F.O.B. Value in Million US Dollar)
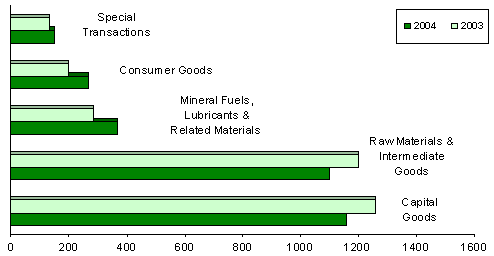
Capital goods account for 38.1 percent of the total imports
Capital goods comprising 38.1 percent of the total imports declined by 7.7 percent year-on-year to $1.160 billion from $1.257 billion. The bigest share went to telecommunication equipment and electrical machinery with a 20.9 percent share of the total imports and billed at $637.28 million. Total annual expenses for Capital Goods for the current year was $15.372 billion. It recorded an increment of 2.3 percent over the previous year.
Payments in December for raw materials and intermediate goods accounted for 36.2 percent as importation diminished by 8.1 percent to $1.101 billion from last year’s figure of $1.198 billion. Semi-processed raw materials got the major share with a 31.6 percent and valued at $960.82 million.
Expenditures for mineral fuels, lubricants and related materials accelerated by 29.7 percent to $369.70 million from $285.02 million during the same period of 2003.
Purchases of consumer goods, amounted to $265.95 million, a rise of 34.3 percent from $198.07 million in December 2003, while special transactions picked up by 11.2 percent to $148.74 million from $133.72 million.
Figure 3. Philippine Imports by Major Type of Goods in December: 2003 and 2004
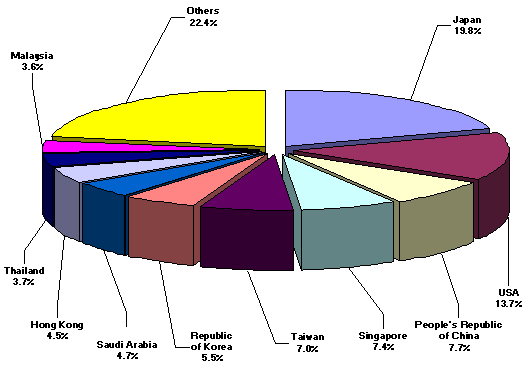
Japan corners 19.8 percent of december import bill
Imports from Japan accounting for 19.8 percent of the total import bill, went down by 8.6 percent to $604.17 million from $661.39 million during the same period of 2003. On the contrary, exports to Japan, amounted to $630.93 million yielding a two-way trade value of $1.235 billion and a trade surplus for RP placed at $26.75 million. The cumulative imports from Japan for 2004 was $7.445 billion with an annual negative growth of 2.6 percent.
United States, the country’s second biggest source of imports for December with a 13.7 percent share, reported shipments billed at $417.41 million against exports earnings of $509.45 million. Total trade amounted to $926.86 million, with a trade surplus registered at $92.03 million.
People’s Republic of China followed as the third biggest source of imports. With payments worth $235.22 million, imports grew by 30.4 percent from $180.36 million, while revenue from RP’s exports reached $279.08 million resulting to a total trade value of $514.30 million and a $43.86 million surplus for Philippines.
Other major sources of imports for the month of December were Singapore, $224.78 million; Taiwan, $213.09 million; Republic of Korea, $169.17 million; Saudi Arabia, $143.24 million; Hong Kong, $135.80 million; Thailand, $111.72 million; and Malaysia, $109.58 million.
Payments for imports from the top ten sources for the month amounted to $2.364 billion or 77.6 percent of the total.
Figure 4. Philippine Imports by Country in December: 2004
As of press time 33 out of 52,964 export documents and 56 out of 71,755 import documents are still expected from the ports.
|
(Sgd.) CARMELITA N. ERICTA |