
EXTERNAL TRADE PERFORMANCE
FEBRUARY 2015
(Preliminary)
|
|
February
|
||
|---|---|---|---|
|
|
2015 p |
2014 r |
|
|
TOTAL IMPORTS FOB Value in Million US Dollars Year-on-Year Growth (Percent) Electronic Products FOB Value in Million US Dollars Year-on-Year Growth (Percent) |
5,326.17 11.2
1,853.51 42.4 |
4,787.99 1.7
1,301.80 3.9 |
|
|
Top 10 Philippine Imports from All Countries: February 2015 p
(Year-on-Year Growth in Percent)
|
|||
|---|---|---|---|
Gainers |
Losers |
||
|
Miscellaneous Manufactured Articles
|
57.8 |
Transport Equipment
|
-58.1 |
|
Electronic Products
|
54.3 |
Mineral Fuels, Lubricants and Related Materials
|
-43.4 |
|
Electronic Products
|
42.4 |
Telecommunication Equipment and Electrical Machinery
|
-3.6 |
|
Cereals and Cereal Preparation
|
39.0 |
|
|
|
Other Food and Live Animals |
21.0 |
|
|
|
Industrial Machinery and Equipment
|
10.7 |
|
|
|
Plastics in Primary and Non-Primary Forms
|
0.5 |
|
|
p-preliminary, r-revised
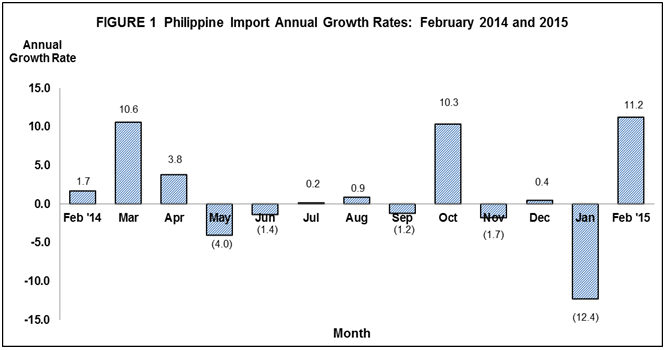
FEBRUARY 2015 IMPORTS INCREASE BY 11.2 PERCENT
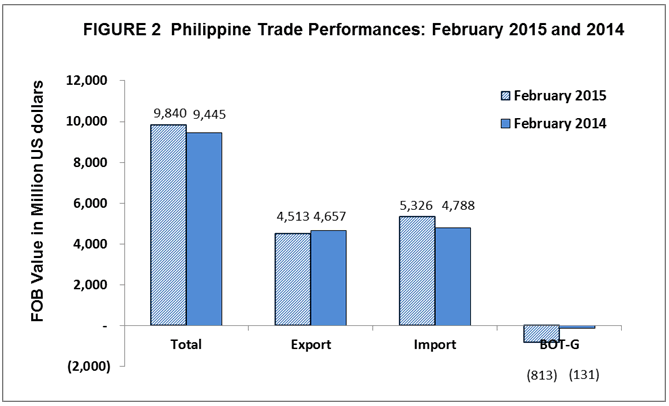
The country’s total external trade in goods for February 2015 amounting to $5.326 billion, increased by 11.2 percent from $4.788 billion recorded during the same period a year ago. The increase in total imports for this period was due to the positive performance of seven out of the top ten major commodities for the month. These were: Miscellaneous Manufactured Articles; Iron and Steel; Electronic Products; Cereals and Cereal Preparations; Other Food & Live Animals; Industrial Machinery and Equipment; and Plastics in Primary and Non-Primary Forms.
Cumulative imports for January to February 2015 amounted to $10.545 billion and showed a 1.8 percent decrease compared with $10.743 billion in the same period of last year.
The balance of trade in goods (BOT-G) for the Philippines in February 2015 registered a deficit of $812.77 million compared to the $130.93 million trade deficit in the same period last year.
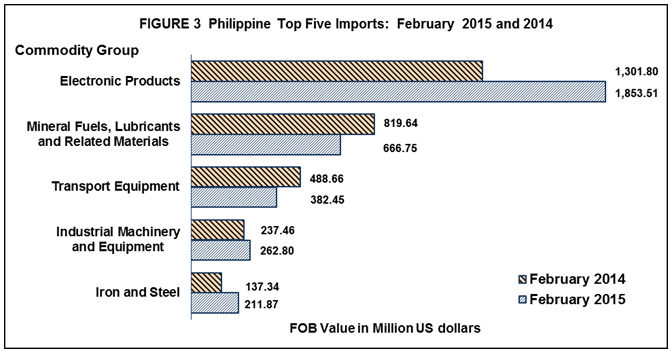
ELECTRONIC PRODUCTS ACCOUNTS FOR 34.8 PERCENT OF IMPORT BILL
Inward shipments of Electronic Products were the top imported commodity in February 2015, accounting for 34.8 percent of the aggregate import bill and value amounting to $1.854 billion. It increased by 42.4 percent over last year's figure of $1.302 billion. Among the major groups of electronic products, Components/Devices (Semiconductors), having the biggest share of 28.8 percent among electronic products, grew by 43.9 percent to $1.535 billion in February 2015 from $1.067 billion in February 2014.
Imports of Mineral Fuels, Lubricants and Related Materials ranked second with 12.5 percent share and reported value of $666.75 million in February 2015. It declined by 18.7 percent from $819.64 million in February 2014.
Transport Equipment placed third with 7.2 percent share to total imports valued at $382.45 million. It decelerated by 21.7 percent from previous year’s level of $488.66 million.
Industrial Machinery and Equipment, contributing 4.9 percent to the total import bill was the country’s fourth top import for the month amounting to $262.80 million. It went up by 10.7 percent compared to last year’s value of $237.46 million.
Fifth in rank and with 4.0 percent share to the total imports, Iron and Steel recorded $211.87 million worth of imports. It registered a 54.3 percent increase from its year ago level of $137.34 million.
Rounding up the list of the top ten imports for February 2015 were: Other Food and Live Animals valued at $171.94 million; Cereals and Cereal Preparations, $140.40 million; Plastics in Primary and Non-Primary Forms, $129.51 million; Miscellaneous Manufactured Articles amounting to $129.16 million; and Telecommunication Equipment and Electrical Machinery, $103.51 million.
Aggregate payment for the country’s top ten imports for February 2015 reached $4.052 billion or 76.1 percent of the total import bill.
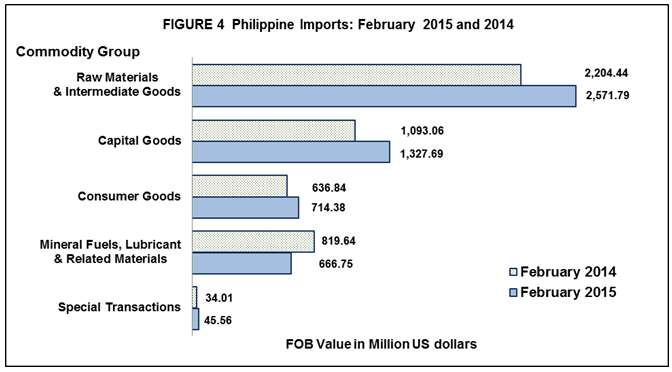
RAW MATERIALS AND INTERMEDIATE GOODS ACCOUNTS FOR 48.3 PERCENT OF THE TOTAL IMPORTS
Payments for purchases of Raw Materials and Intermediate Goods in February 2015 valued at $2.572 billion and accounted for 48.3 percent of the total imports. It increased by 16.7 percent over last year's figure of $2.204 billion. Semi-Processed Raw Materials had the biggest share of 44.5 percent valued at $2.369 billion.
Payments for inward shipments of Capital Goods accounting for 24.9 percent of the total imports rose by 21.5 percent to $1.328 billion in February 2015 from $1.093 billion in February 2015.
Purchases of Consumer Goods recorded 13.4 percent share with a total import bill valued at $714.38 million in February 2015. It increased by 12.2 percent from $636.84 million registered in February 2014.
Mineral Fuels, Lubricants and Related Materials with 12.5 percent share to total imports declined by 18.7 percent from $819.64 million in February 2014 to $666.75 million in February 2015. Other mineral fuels, lubricants and related materials such as gas oils, aviation spirit, solvent naphtha, mixture of propane and butane and motor spirit (regular and premium unleaded) contributed the biggest share of imports in this commodity group.
Special Transactions rose by 33.9 percent to $45.56 million in February 2015 from $34.01 million in same month last year.
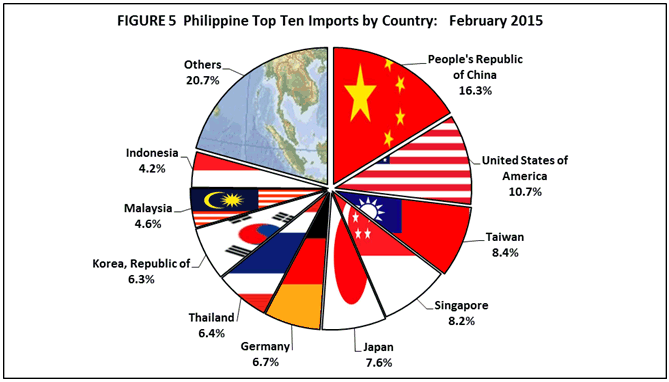
IMPORTS FROM PEOPLE’S REPUBLIC OF CHINA ACCOUNTS FOR 16.3 PERCENT
People’s Republic of China remained as the country’s biggest source of imports with 16.3 percent share in February 2015. Payments were recorded at $865.59 million, an increase of 47.8 percent from $585.79 million in February 2014. Revenue from country’s exports to China, on the other hand, reached $444.68 million, generating a total trade value of $1.310 billion and $420.90 million trade deficit.
United States of America (USA) including Alaska and Hawaii was second biggest source of imports for February 2015, accounting for 10.7 percent share of the total import bill and with a positive growth of 13.3 percent to $567.88 million from $501.26 million in February 2014. Exports to this country amounted to $731.09 million resulting to a total trade value of $1.299 billion and a trade surplus of $163.20 million.
Taiwan came third, contributing 8.4 percent of the total import bill in February 2015, with import value of $449.20 million. It increased by 32.7 percent from its February 2014 value of $338.49 million. Export receipts from Taiwan in February 2015 reached $146.98 million yielding a total trade value of $596.17 million and a trade deficit of $302.22 million.
Fourth in rank was Singapore accounting for 8.2 percent share of the total import bill worth $436.88 million in February 2015 and increased by 27.9 percent from $341.61 million in February 2014. Exports to Singapore amounted to $267.49 million resulting to a total trade value of $704.38 million and a trade deficit of $169.39 million.
Japan including Okinawa placed fifth, registering a 7.6 percent share to the total import bill amounting to $403.09 million and decreased by 15.2 percent from $475.28 million in February 2014. Exports to Japan amounted to $942.32 billion, yielding a two-way trade value of $1.345 billion and a trade surplus of $539.23 million.
Other major sources of imports for the month of February 2015 were: Germany, $354.98 million; Thailand, $341.41 million; Republic of Korea, $334.87 million; Malaysia, $246.99 million; and Indonesia, $222.98 million.
Aggregate payments for imports from the top ten sources for February 2015 amounted to $4.224 billion or 79.3 percent of the total.
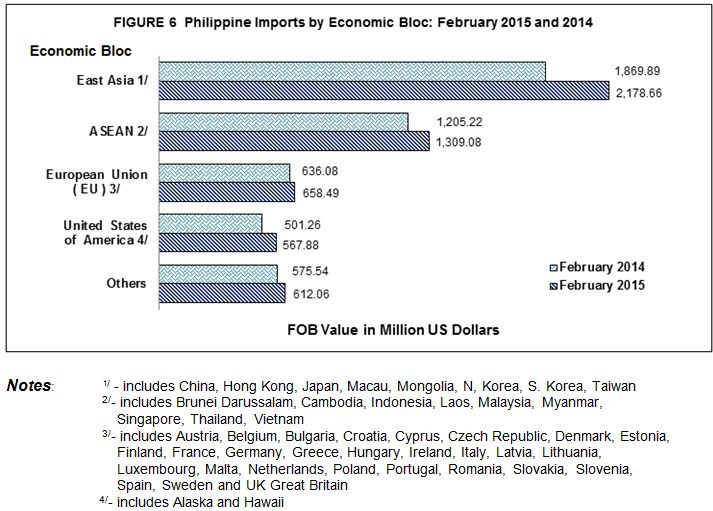
IMPORTED GOODS FROM EAST ASIA ACCOUNTS FOR 40.9 PERCENT
By economic bloc, East Asia (China, Hong Kong, Japan, Macau, Mongolia, North Korea, South Korea and Taiwan) was the biggest source of the country’s imports in February 2015 as it accounted for 40.9 percent of the total imports valued at $2.179 billion. It increased by 16.5 percent from $1.870 billion in February 2014. Total exports to countries in East Asia amounted to $2.170 billion resulting to a total trade of $4.349 billion and a trade deficit of $8.69 million.
Commodities imported from ASEAN member countries were valued at $1.309 billion, contributing 24.6 percent share and increased by 8.6 percent from $1.205 billion recorded in February 2014. Proceeds from exports to ASEAN member countries were worth $723.89 million, resulting to a total trade of $2.033 billion and a trade deficit of $585.19 million.
Imports from European Union were valued at $658.49 million. It accelerated by 3.5 percent compared to a year ago value of $636.08 million. Exports to member countries of European Union were worth $523.26 million, resulting to a total trade of $1.182 billion and a trade surplus of $135.23 million.
Technical Notes:
1. Adjustments on electronic import statistics are based on the transactions that pass through the Electronic to Mobile (e2m) of the Bureau of Customs (BOC).
2. Starting with the 2007 Press Release, analysis and tables are based on the 2004 Philippine Standard Commodity Classification (PSCC) groupings. This is in compliance with NSCB Resolution No. 03, Series of 2005 entitled “Approving and Adopting the 2004 Philippine Standard Commodity Classification” by all concerned government agencies and instrumentalities.
(Sgd.) LISA GRACE S. BERSALES, Ph. D.
National Statistician